Preface
Same as the last time I closed the book It’s kind of a follow up, just in time to (re)start with the part of figuring out the cartoon rendering… *After all, this aspect of the old work left far more problems than it solved ()
There’s plenty of time before the rally, so let’s see how much I can write
- Version: Japanese 5.0.0 (Yakimori update)
- Equipment: Mac Mini M4 (2024)
1. Preparatory work
I’ve run captures with RenderDoc on a live Android device (note: Pixel 2 XL) before… Usability is actually pretty good, except for the relatively weak device performance and slow capture.
But nowadays, with the Mac, it may be possible to avoid imposing such limitations.
I read the README for GPTK when I was tinkering with it earlier, and noticed this rather interesting paragraph:
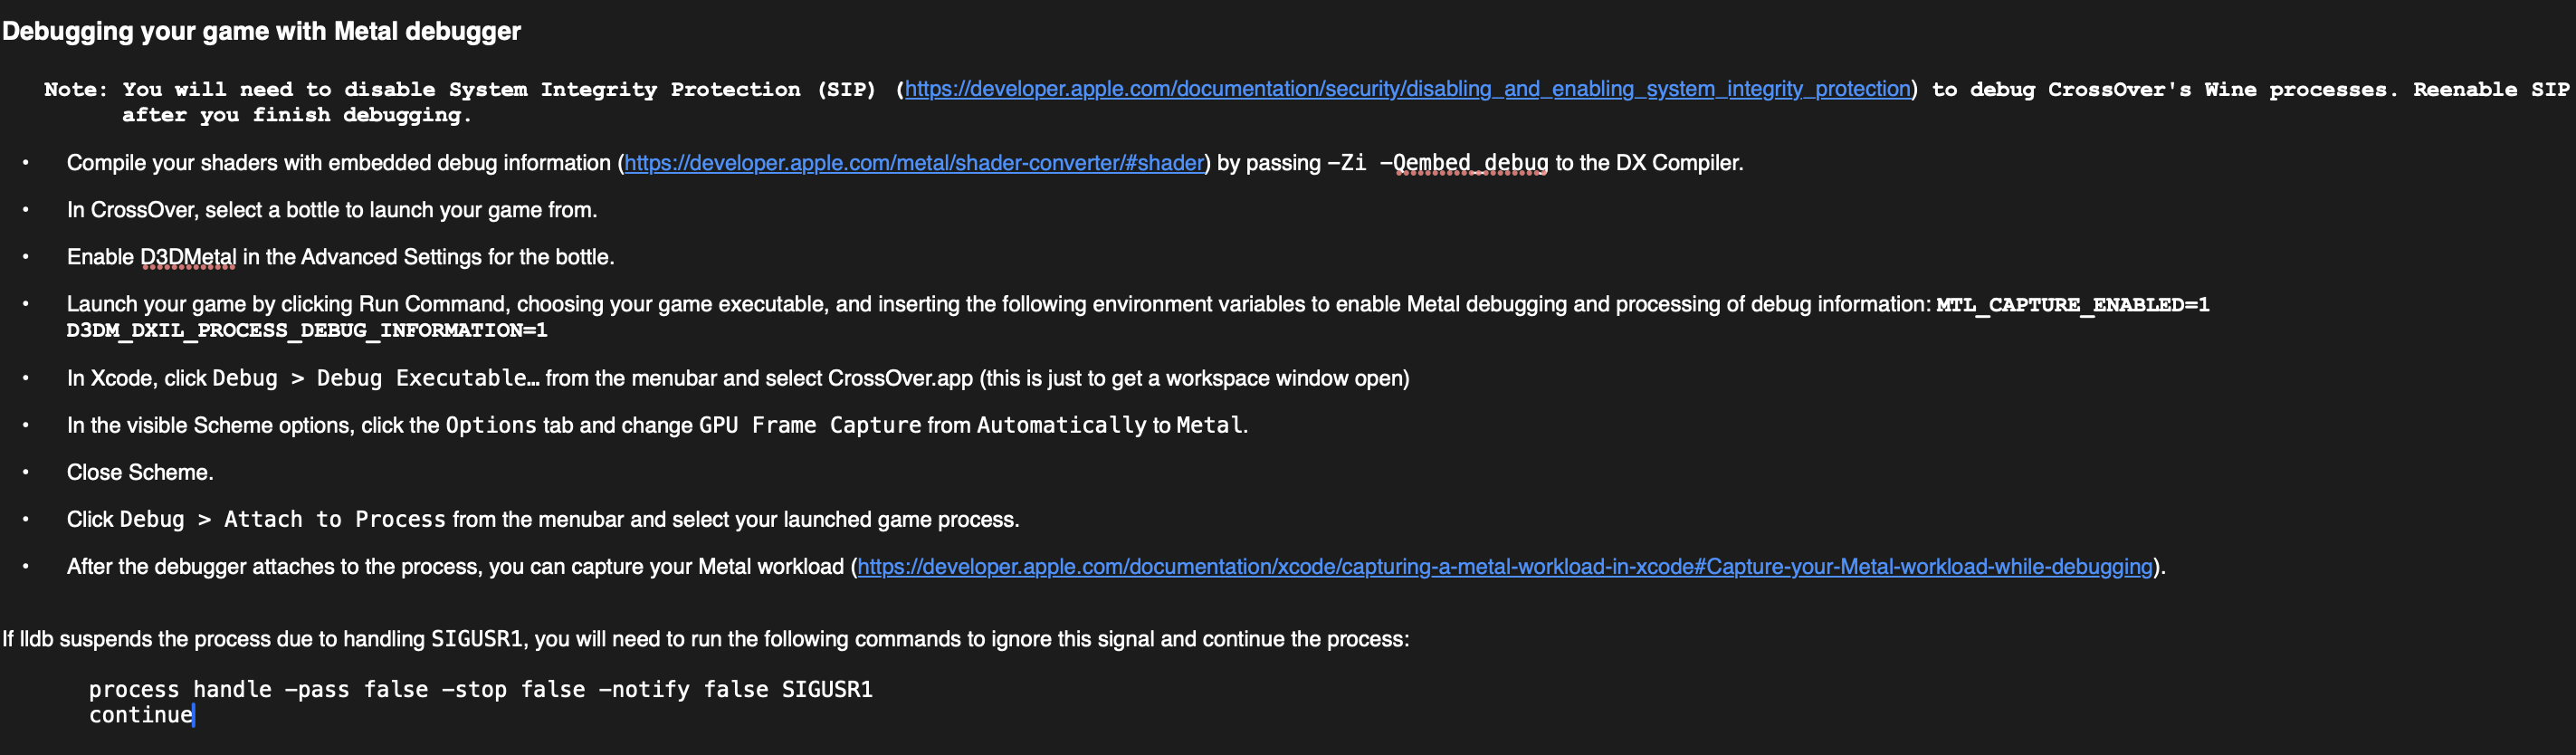
…and inserting the following environment variables to enable Metal debugging and processing of debug information: MTL_CAPTURE_ENABLED=1 D3DM_DXIL_PROCESS_DEBUG_INFORMATION=1
Change environment variables and you can debug… Much easier than capturing a third-party Game on Win; with the latter you learn all sorts of weird injections (?) with RenderDoc/PIX! –But, back to the point, does this variable work well outside of the wine + D3DMetal translation layer?
Game preparation
Apple Silicon’s Macs without exception can run iPhone/iPad OS apps natively – zero CPU, zero GPU overhead!
But note the “can”, there aren’t many apps on the AppStore that can be installed directly…
But fortunately there is also PlayCover which can load decrypted IPA directly; the latter armconverter can be found by searching
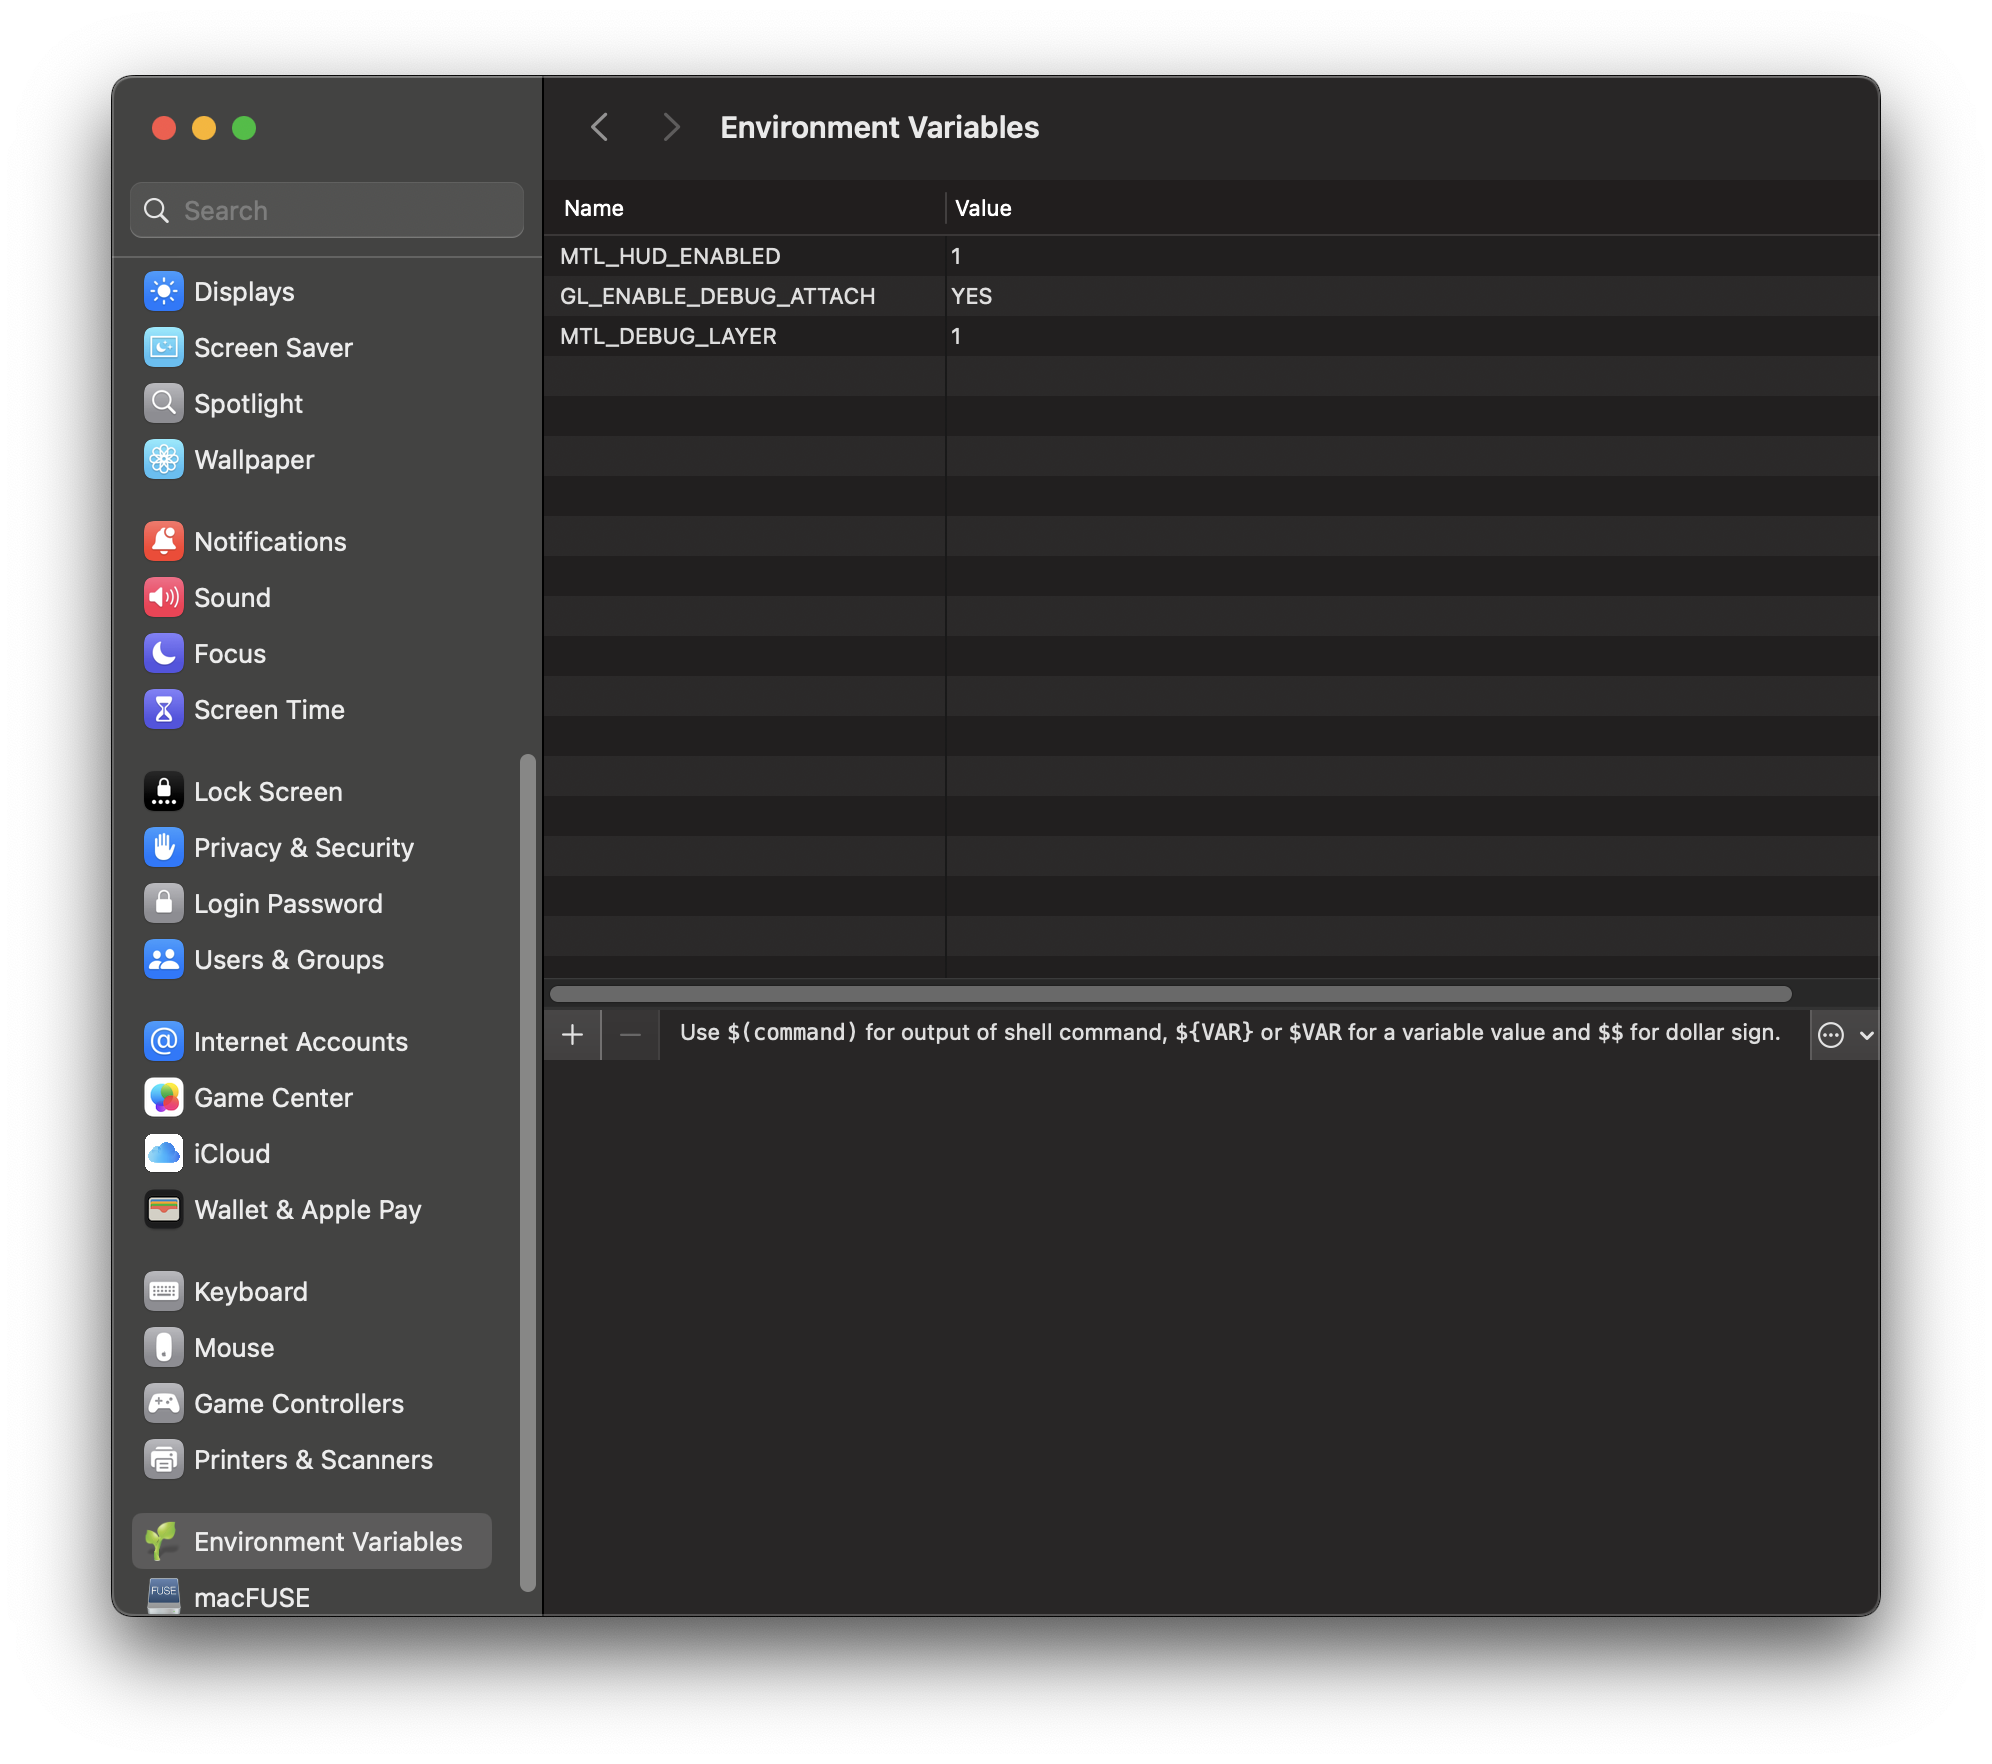
Environment variables
I can’t believe I’m trying to go straight to the settings with my muscle memory on Windows ==
But other than launching after calling variables from the shell there’s actually something like this on the mac: EnvPane
Try turning on MTL_DEBUG_LAYER; here MTL_HUD_ENABLED just turns on Metal performance HUD globally.
That said, it can also be set up directly in Xcode, so this step can be skipped.
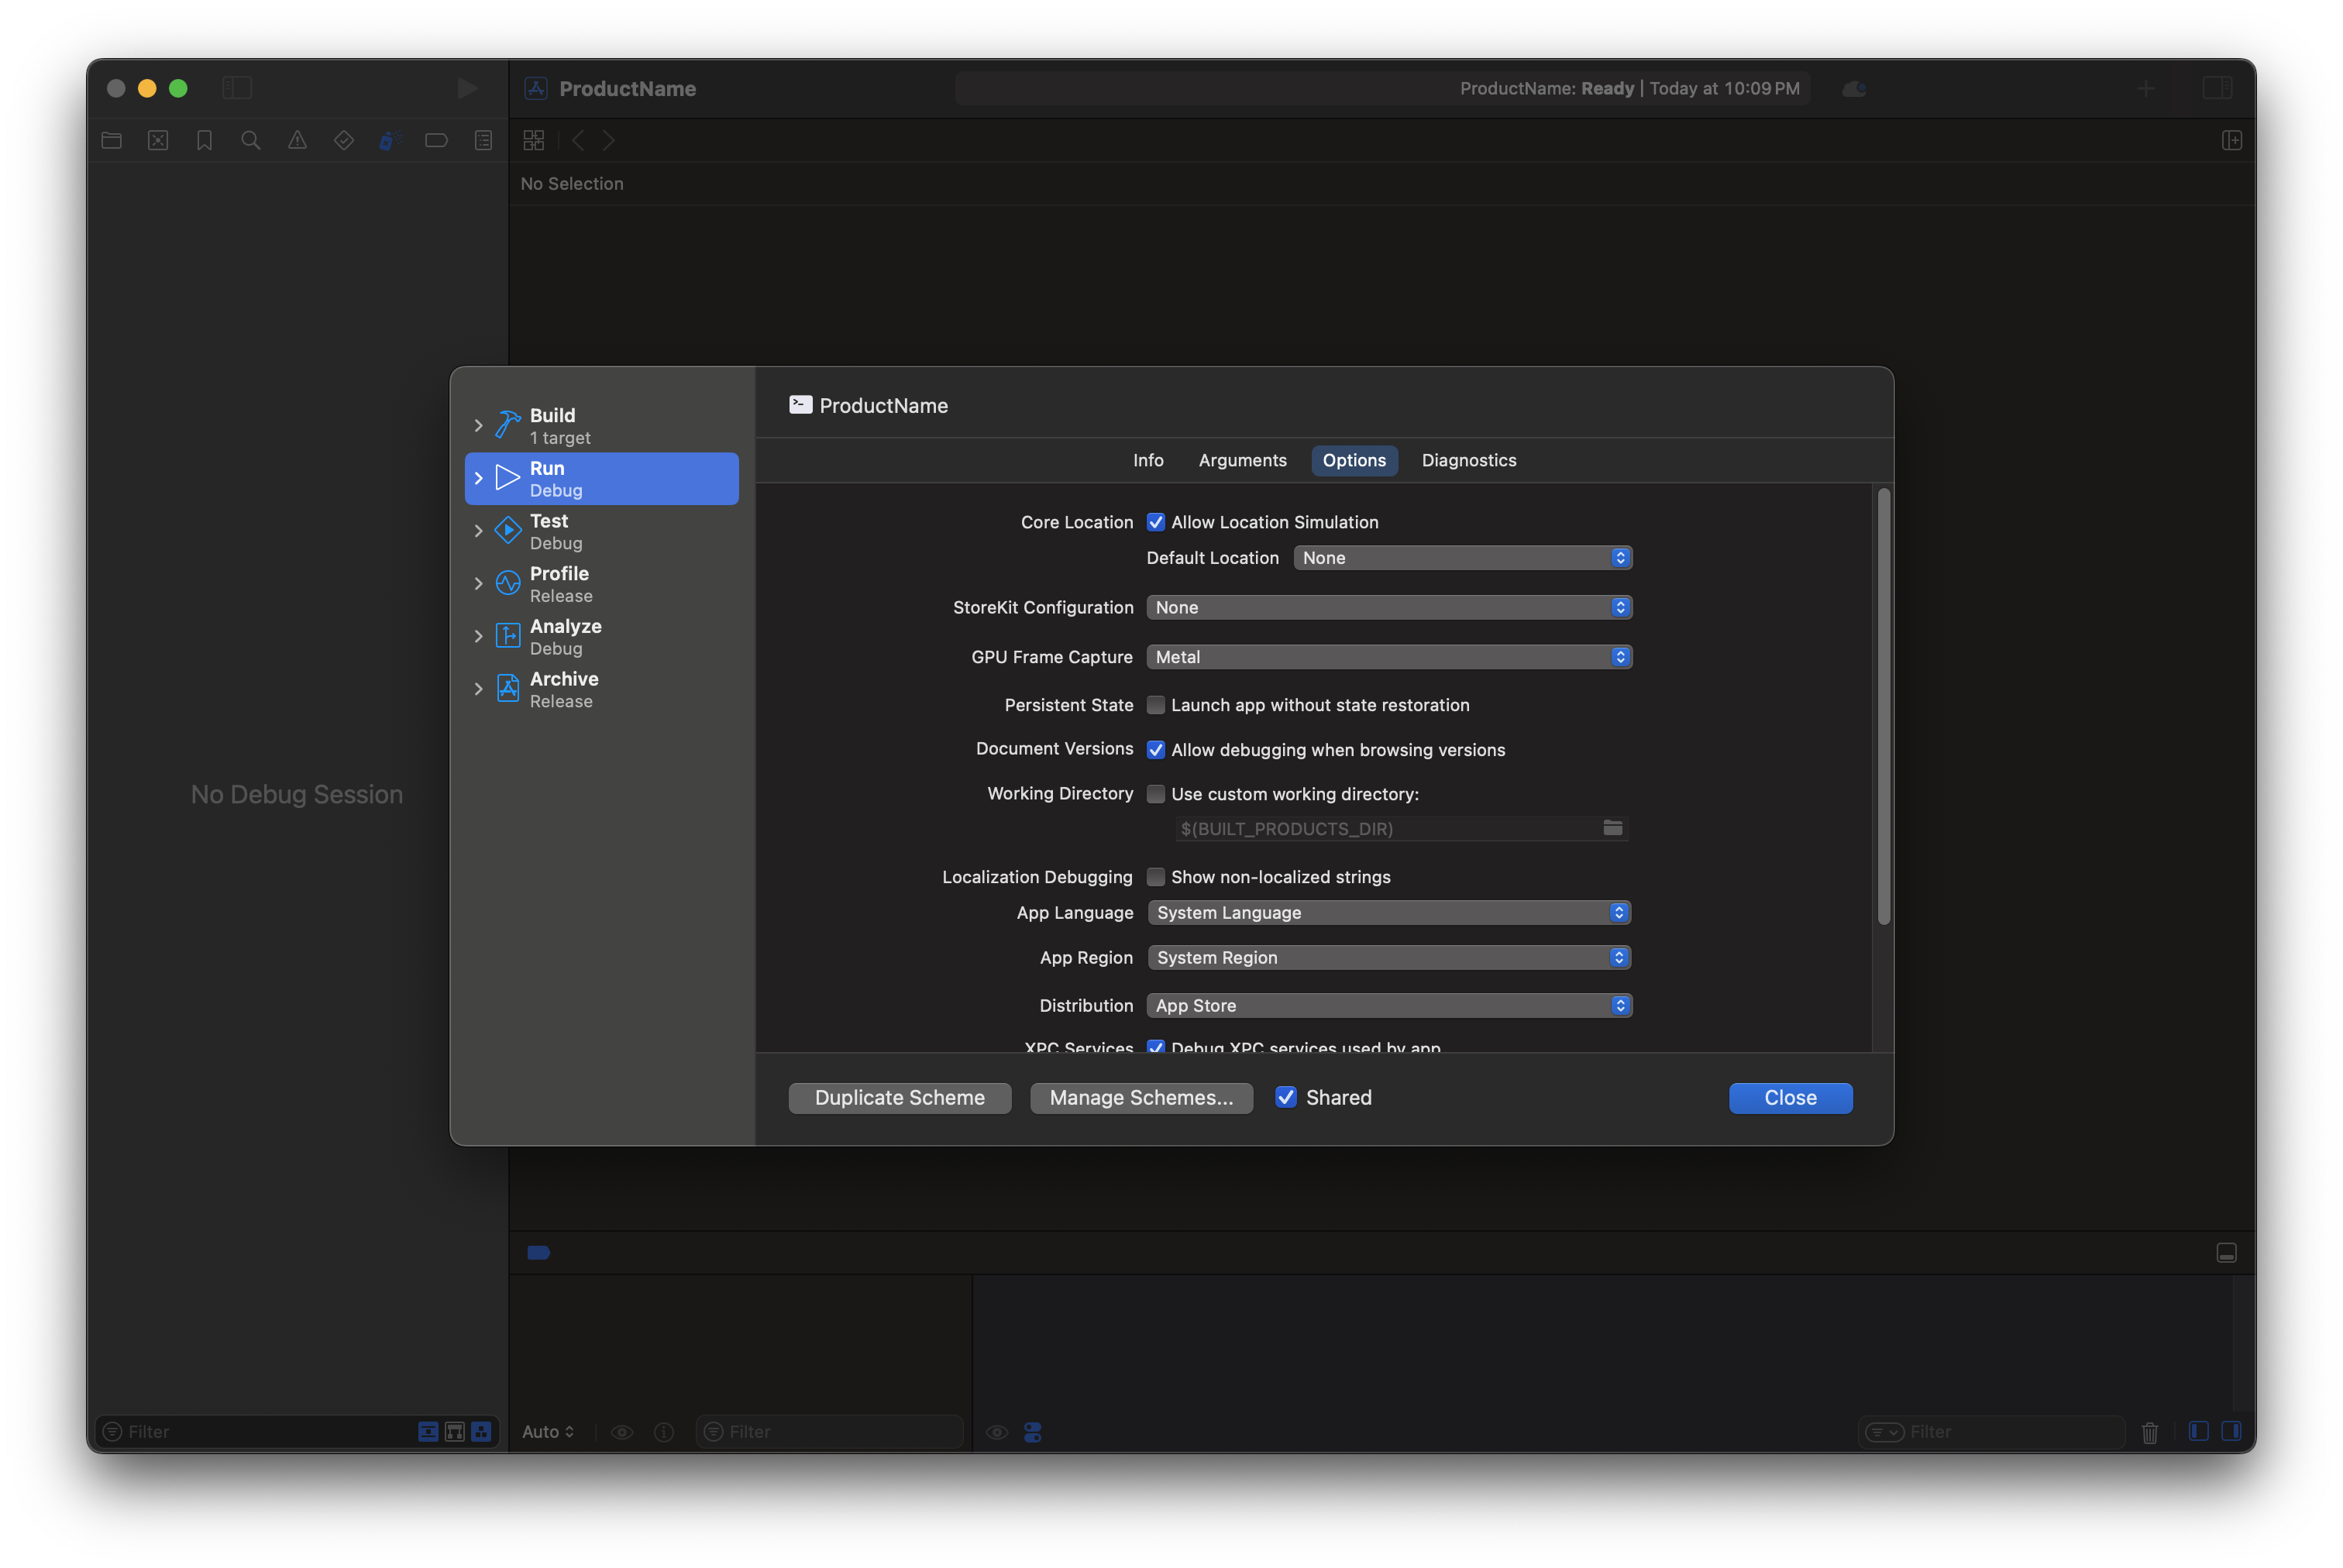
Xcode configuration
Starting with empty projects
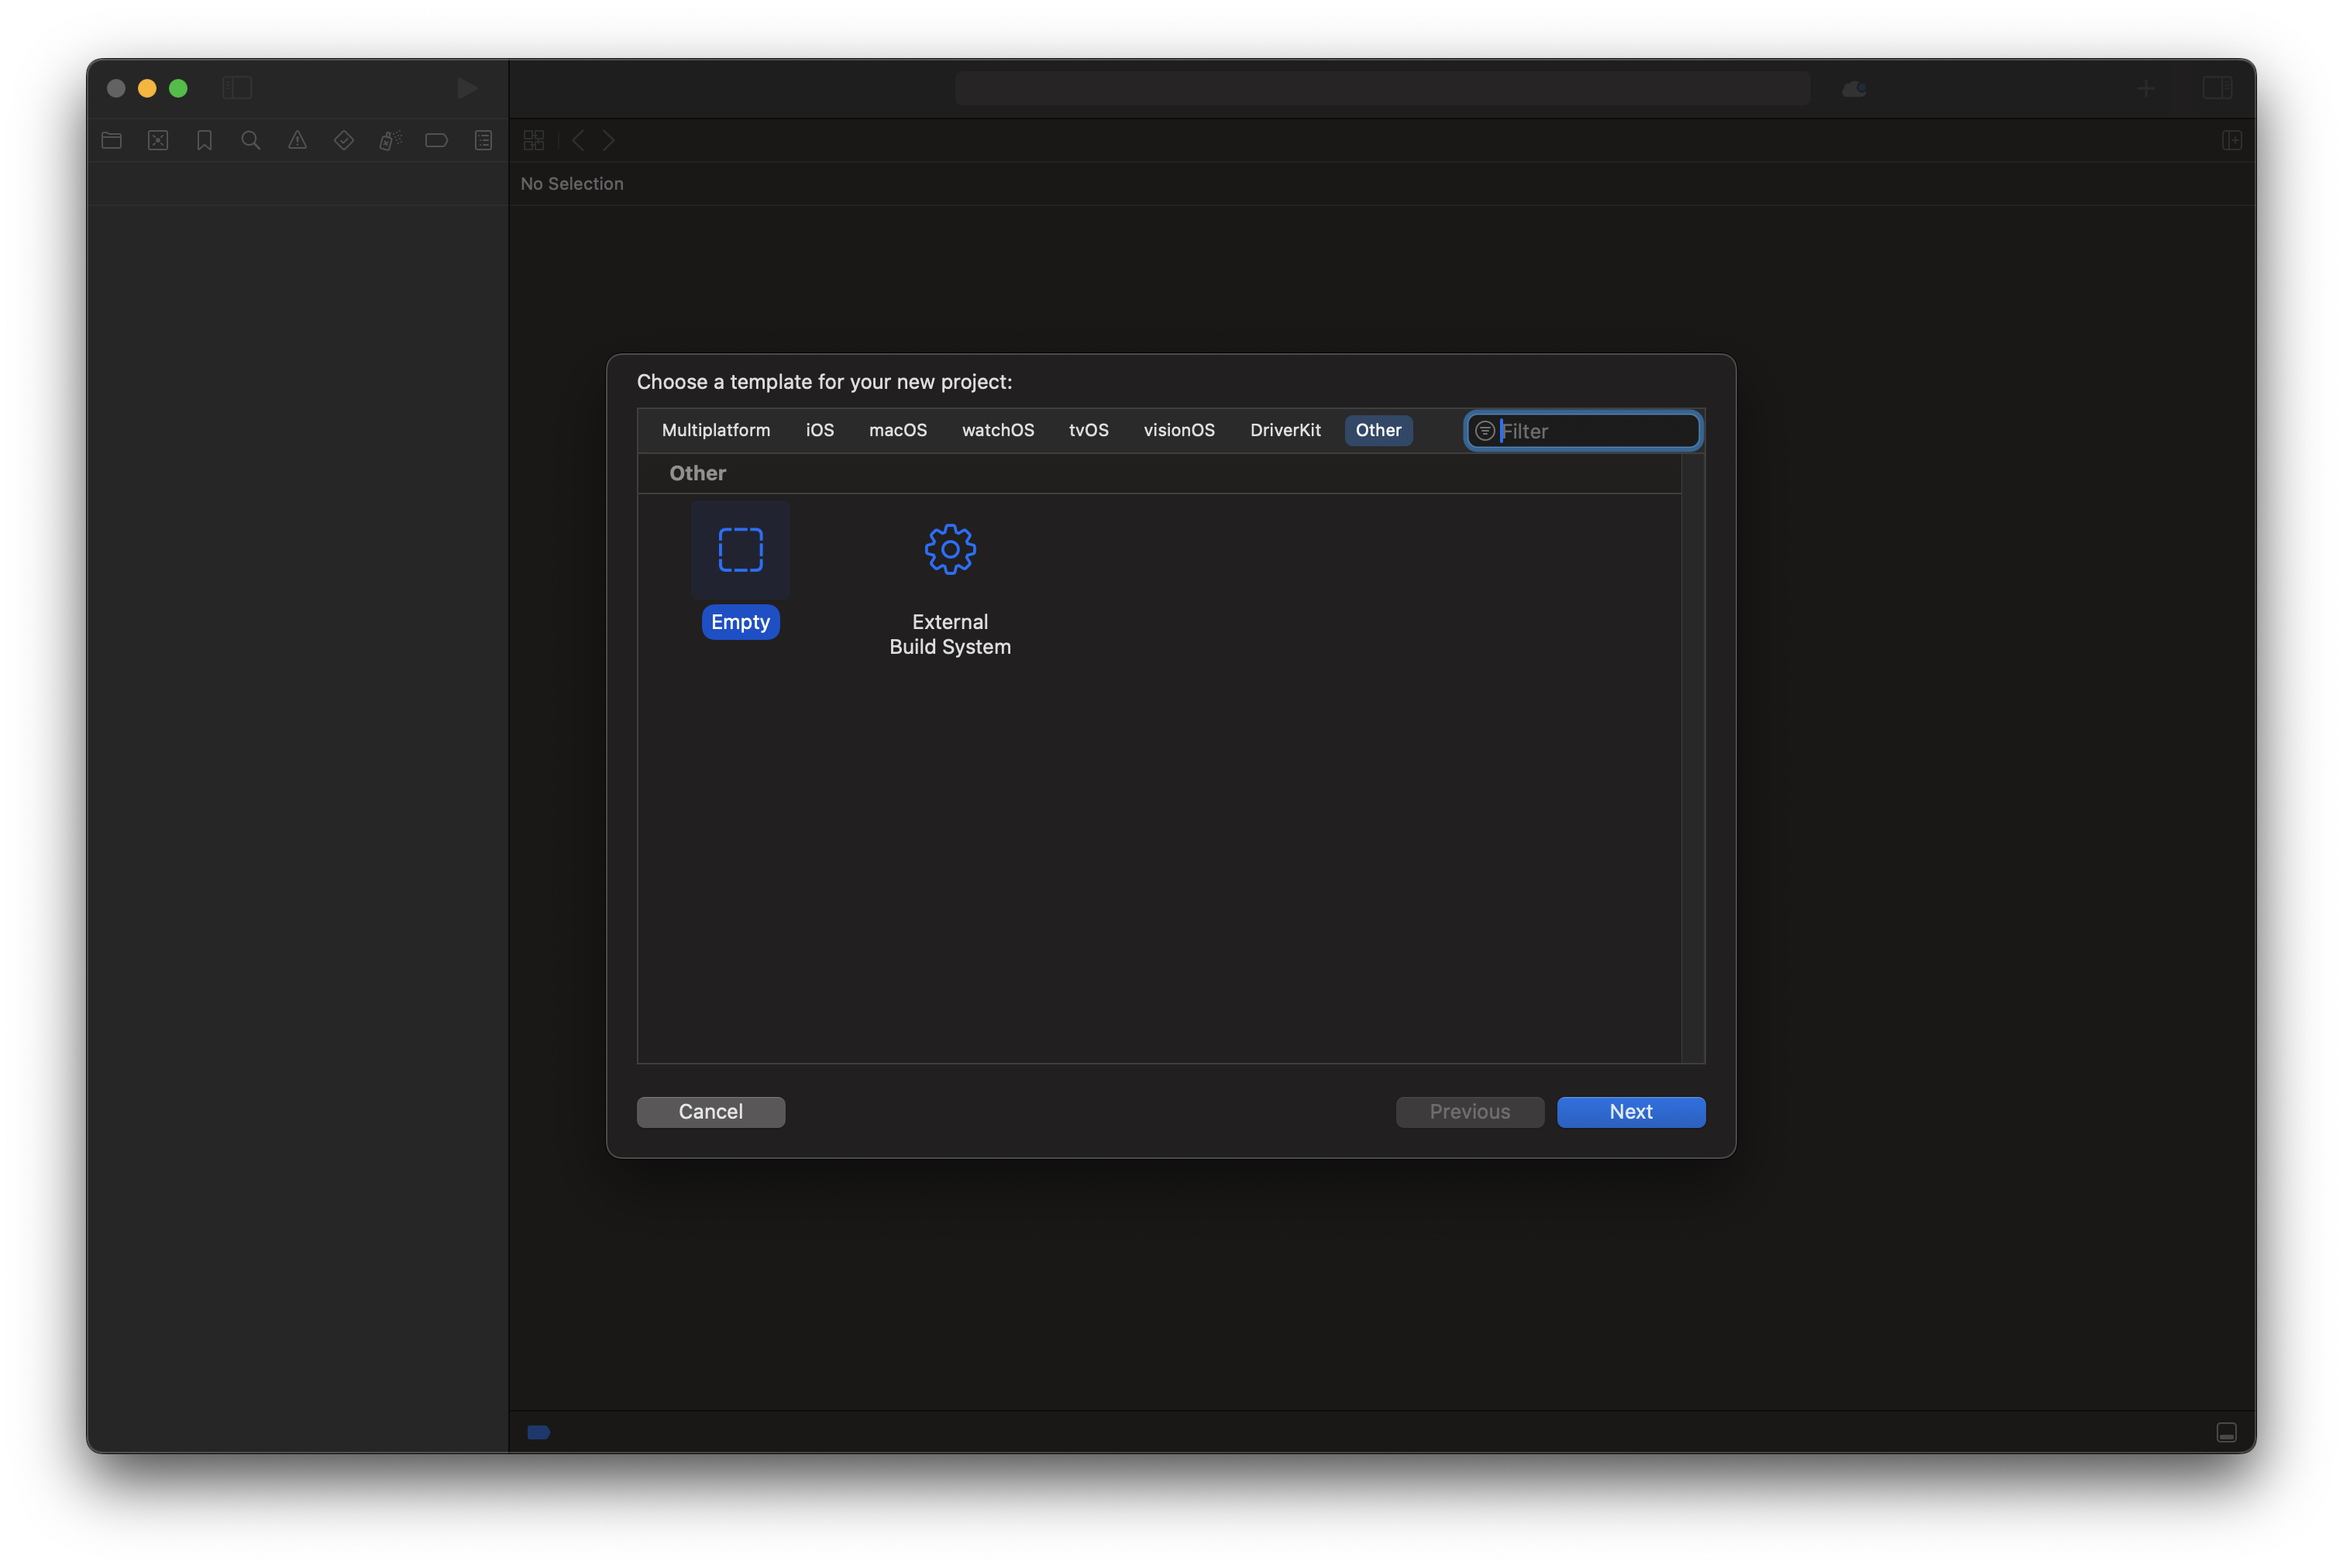
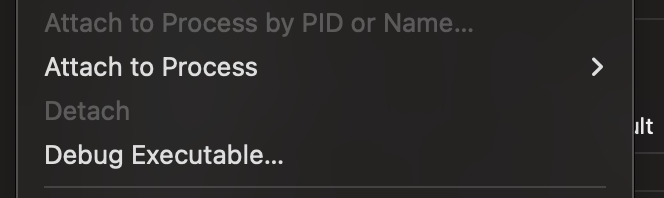
I don’t know why Debug > Attach To Process never refreshes, so I just use Debug > Debug Executable.
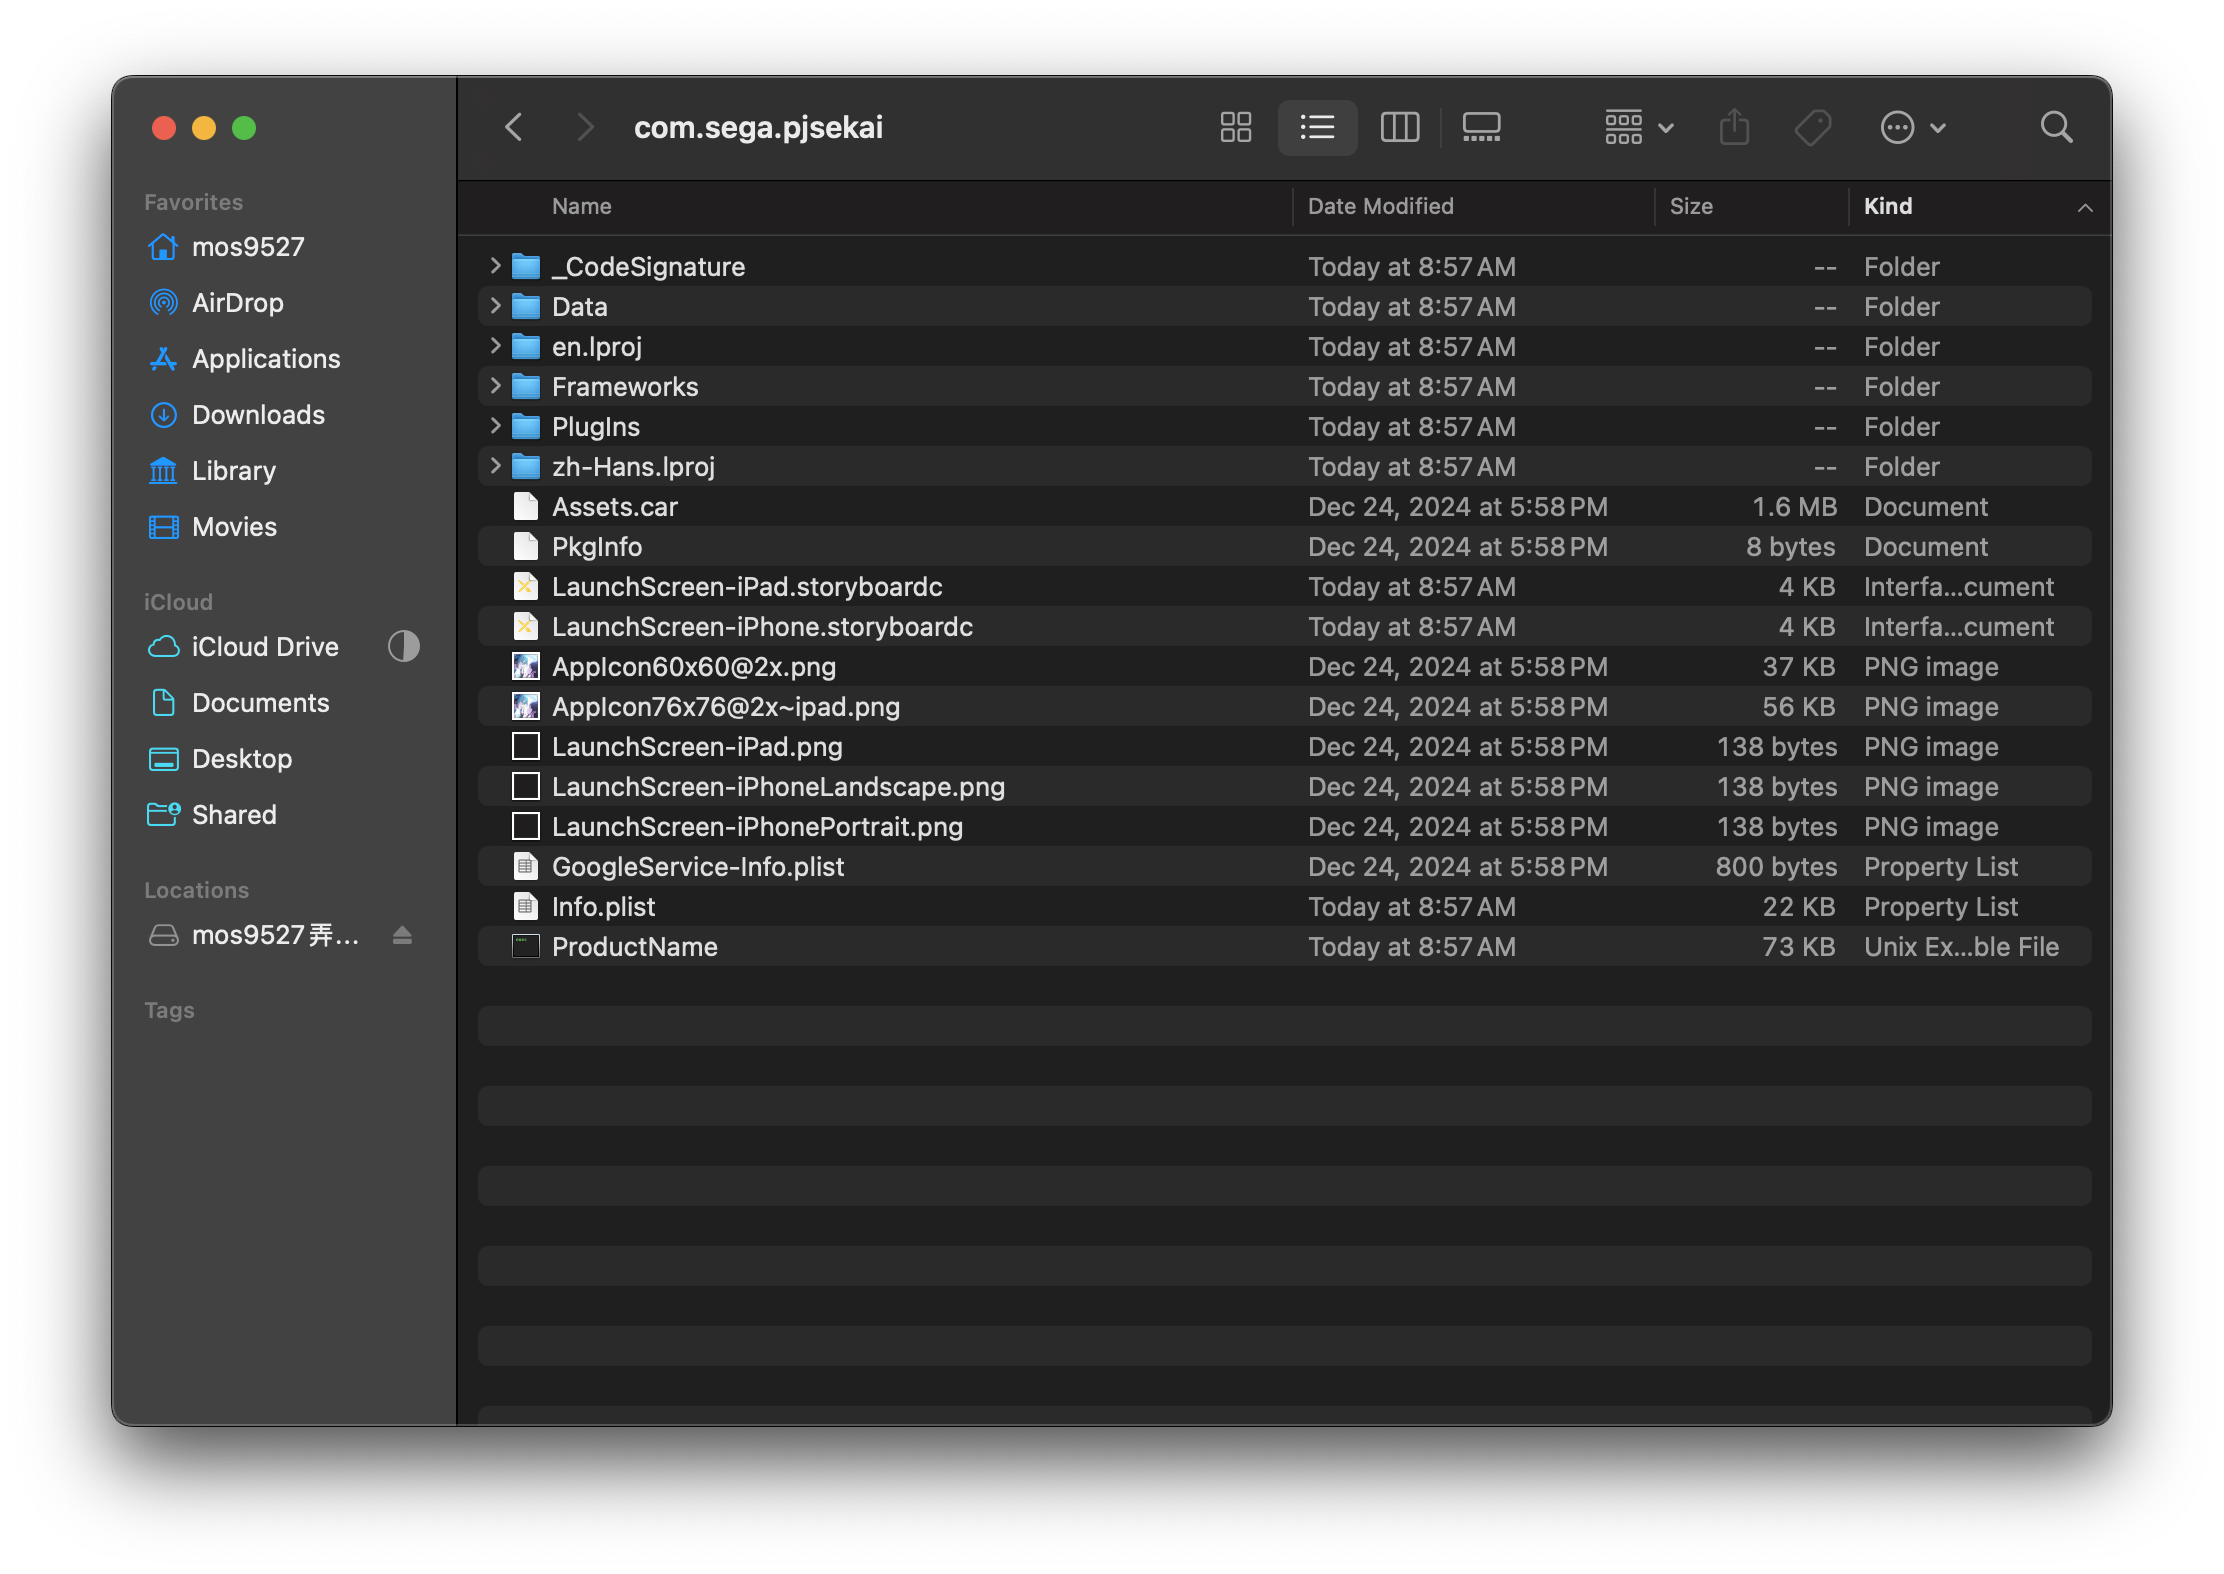
Be careful not to select the app icon created by PlayCover when selecting the destination - Xcode will treat it as an iOS app resulting in no debugging Destination afterward!
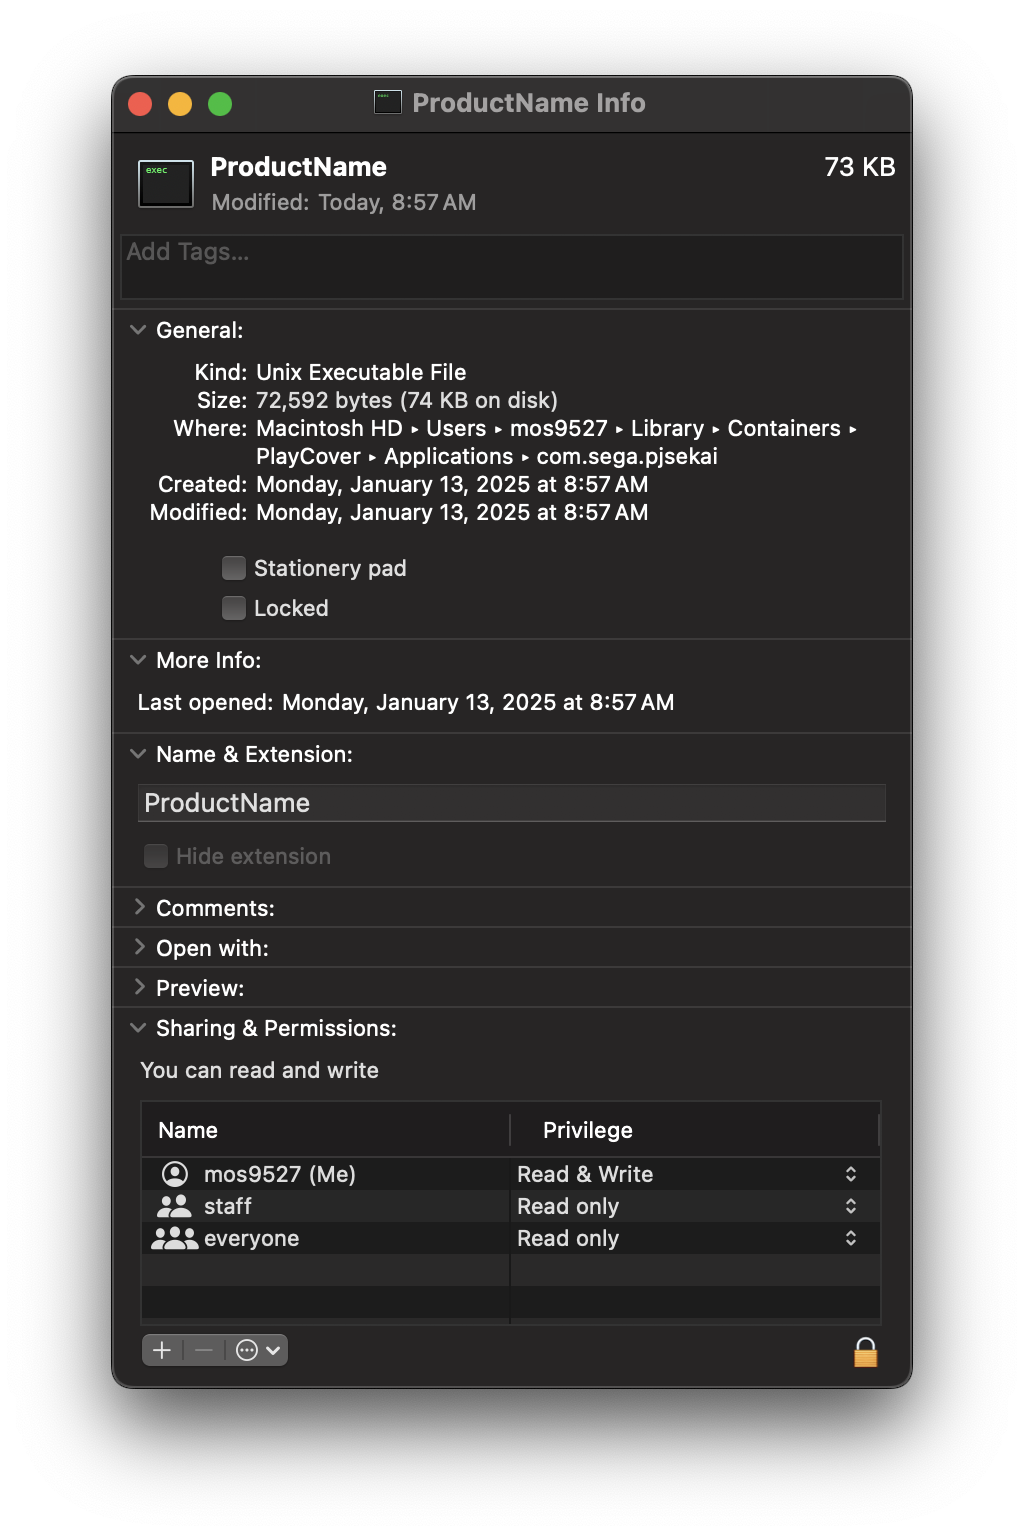
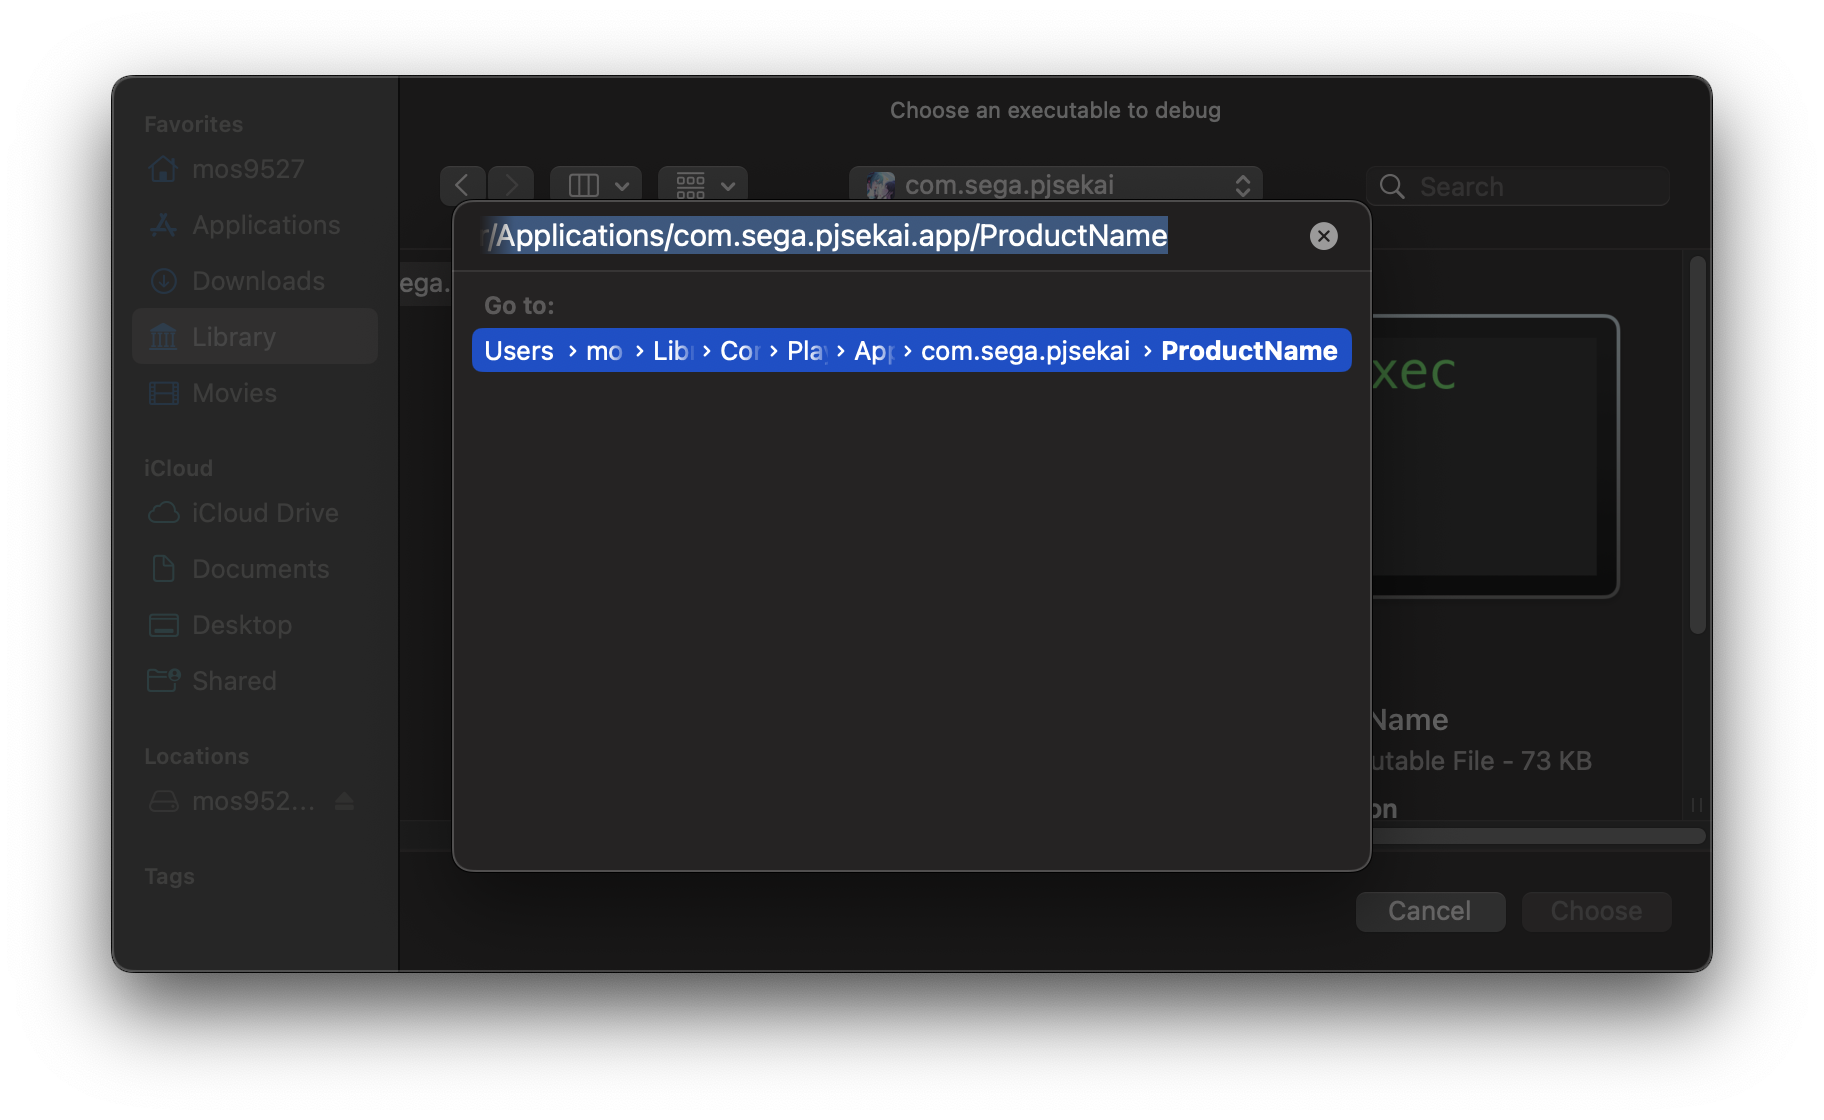
Here you need to select the App’s own binary ProductName in the following location
⌘⇧+G locates the file where it is located and selects it
Options > GPU Frame Capture to Metal; this can also be changed later by Product > Scheme > Edit Scheme.
Launching directly, you can observe that the game spits out some logs
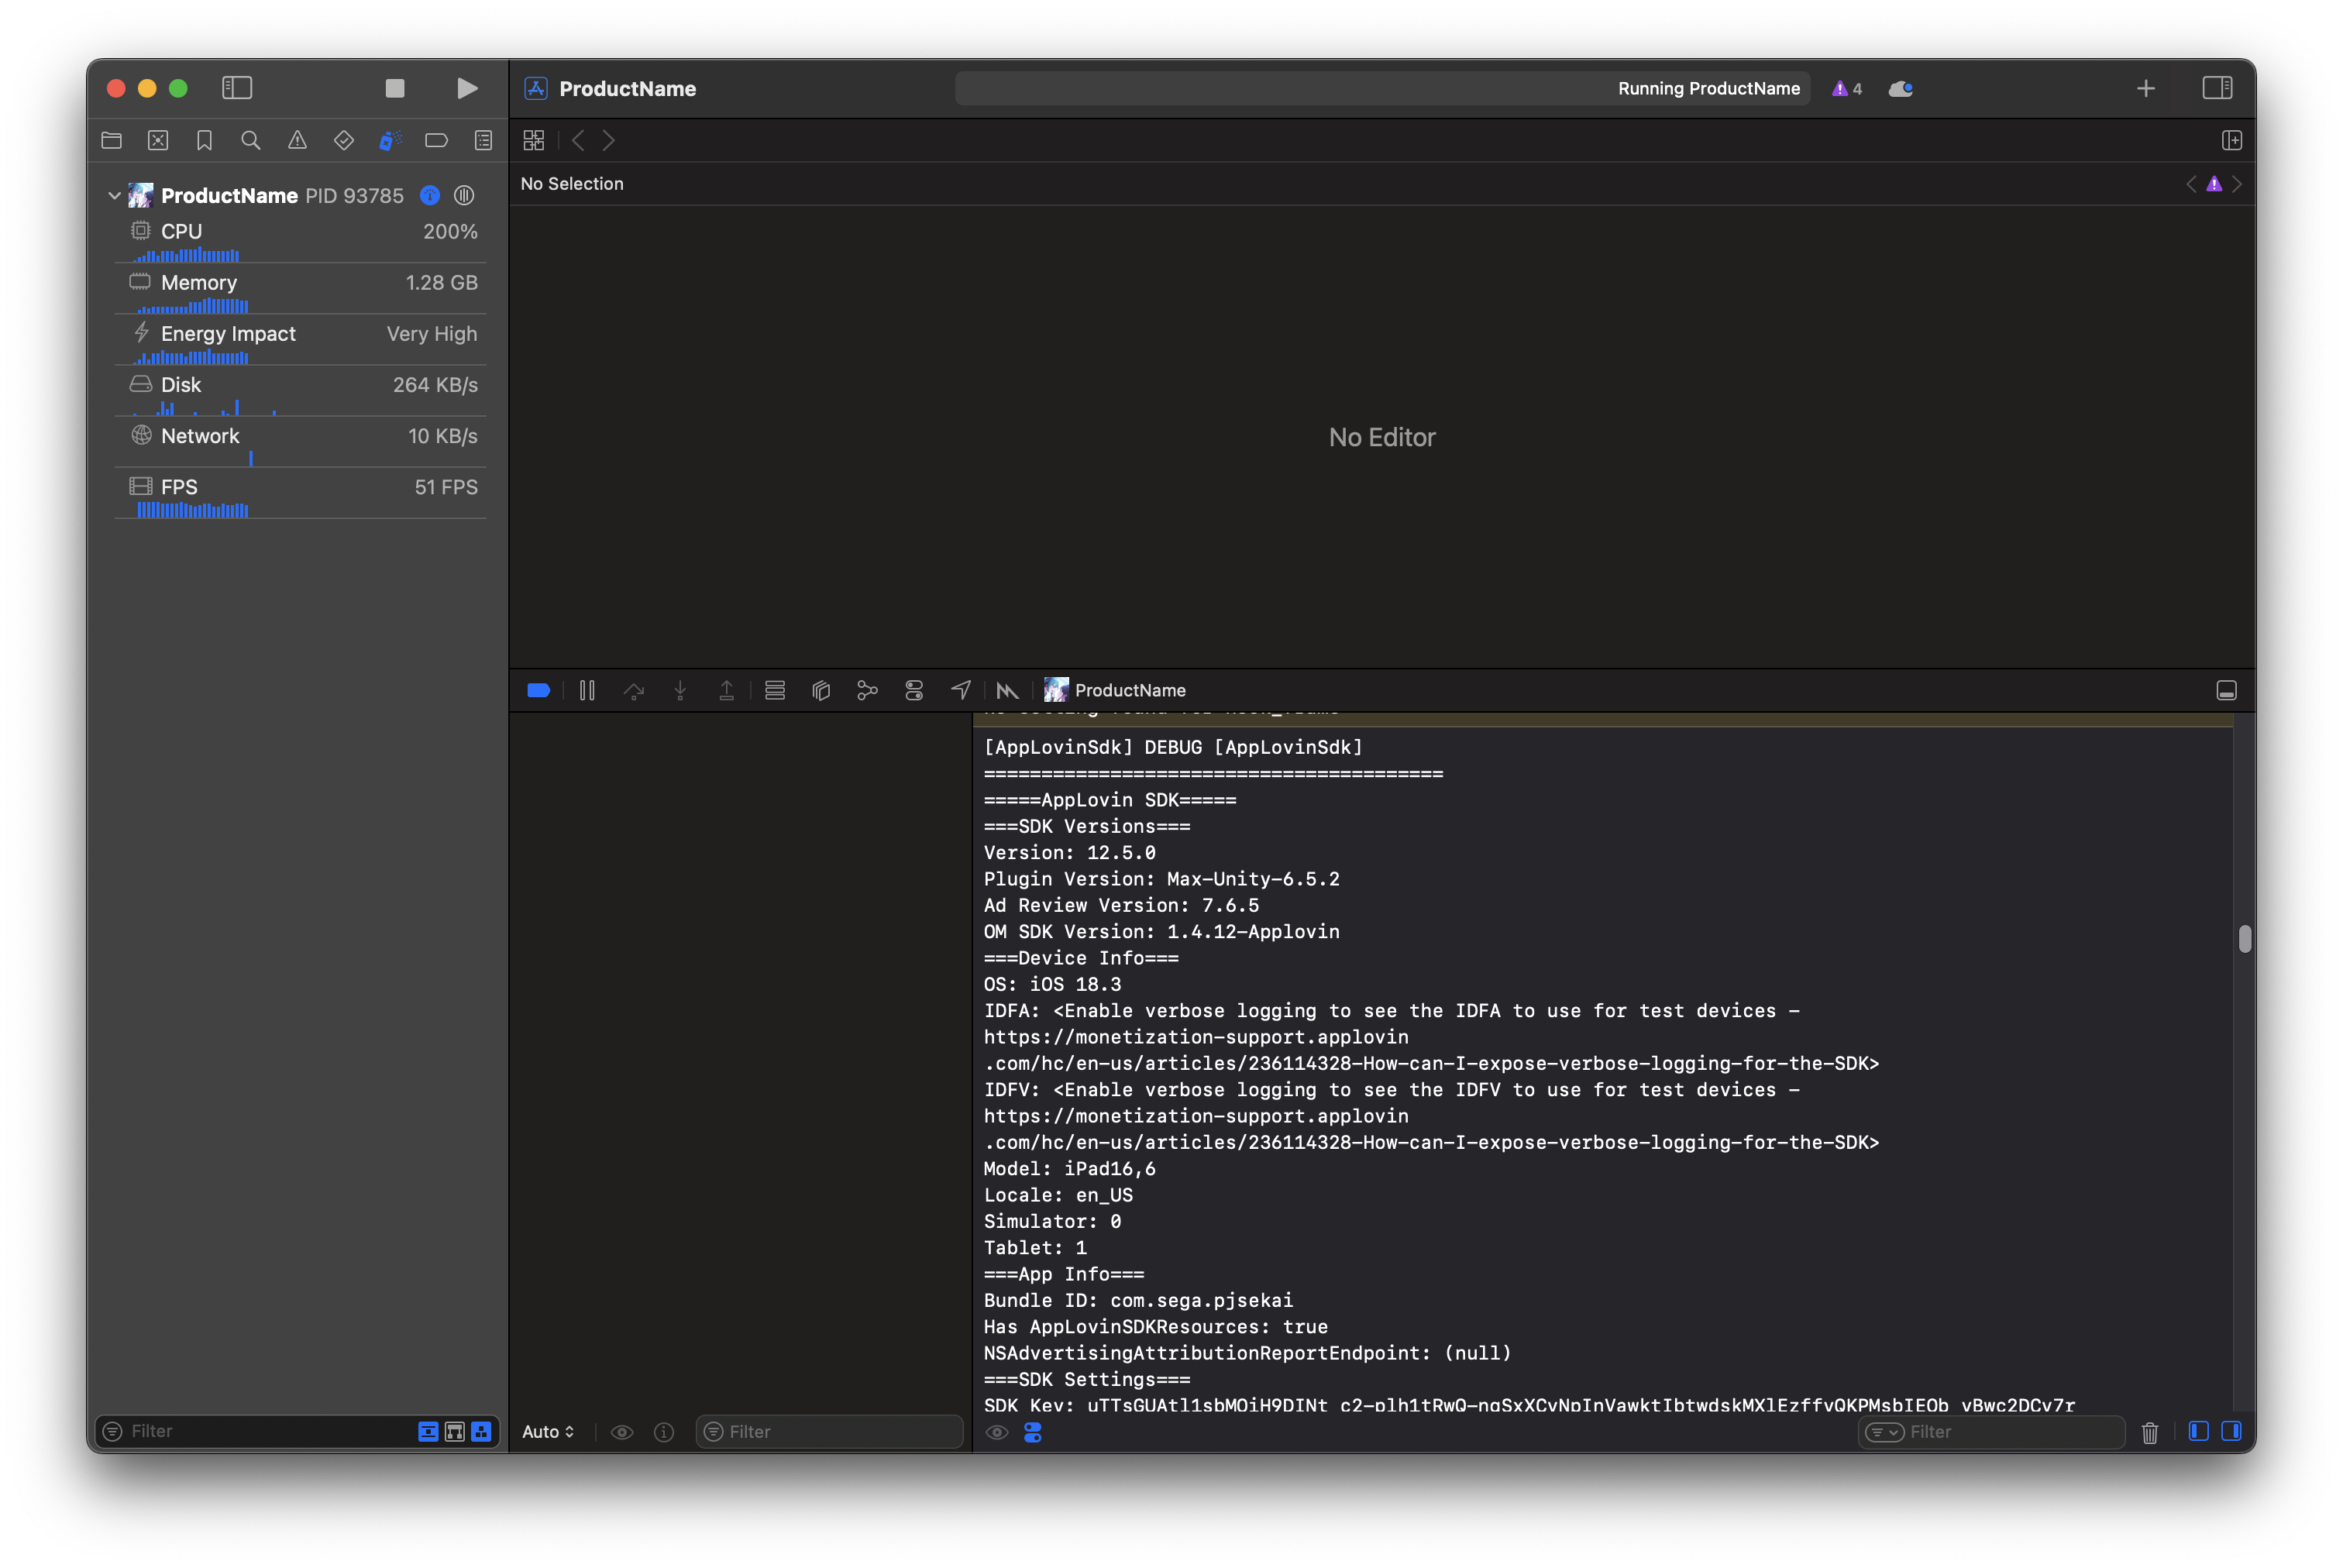
Not useful for now; HUD indicators can be observed after startup
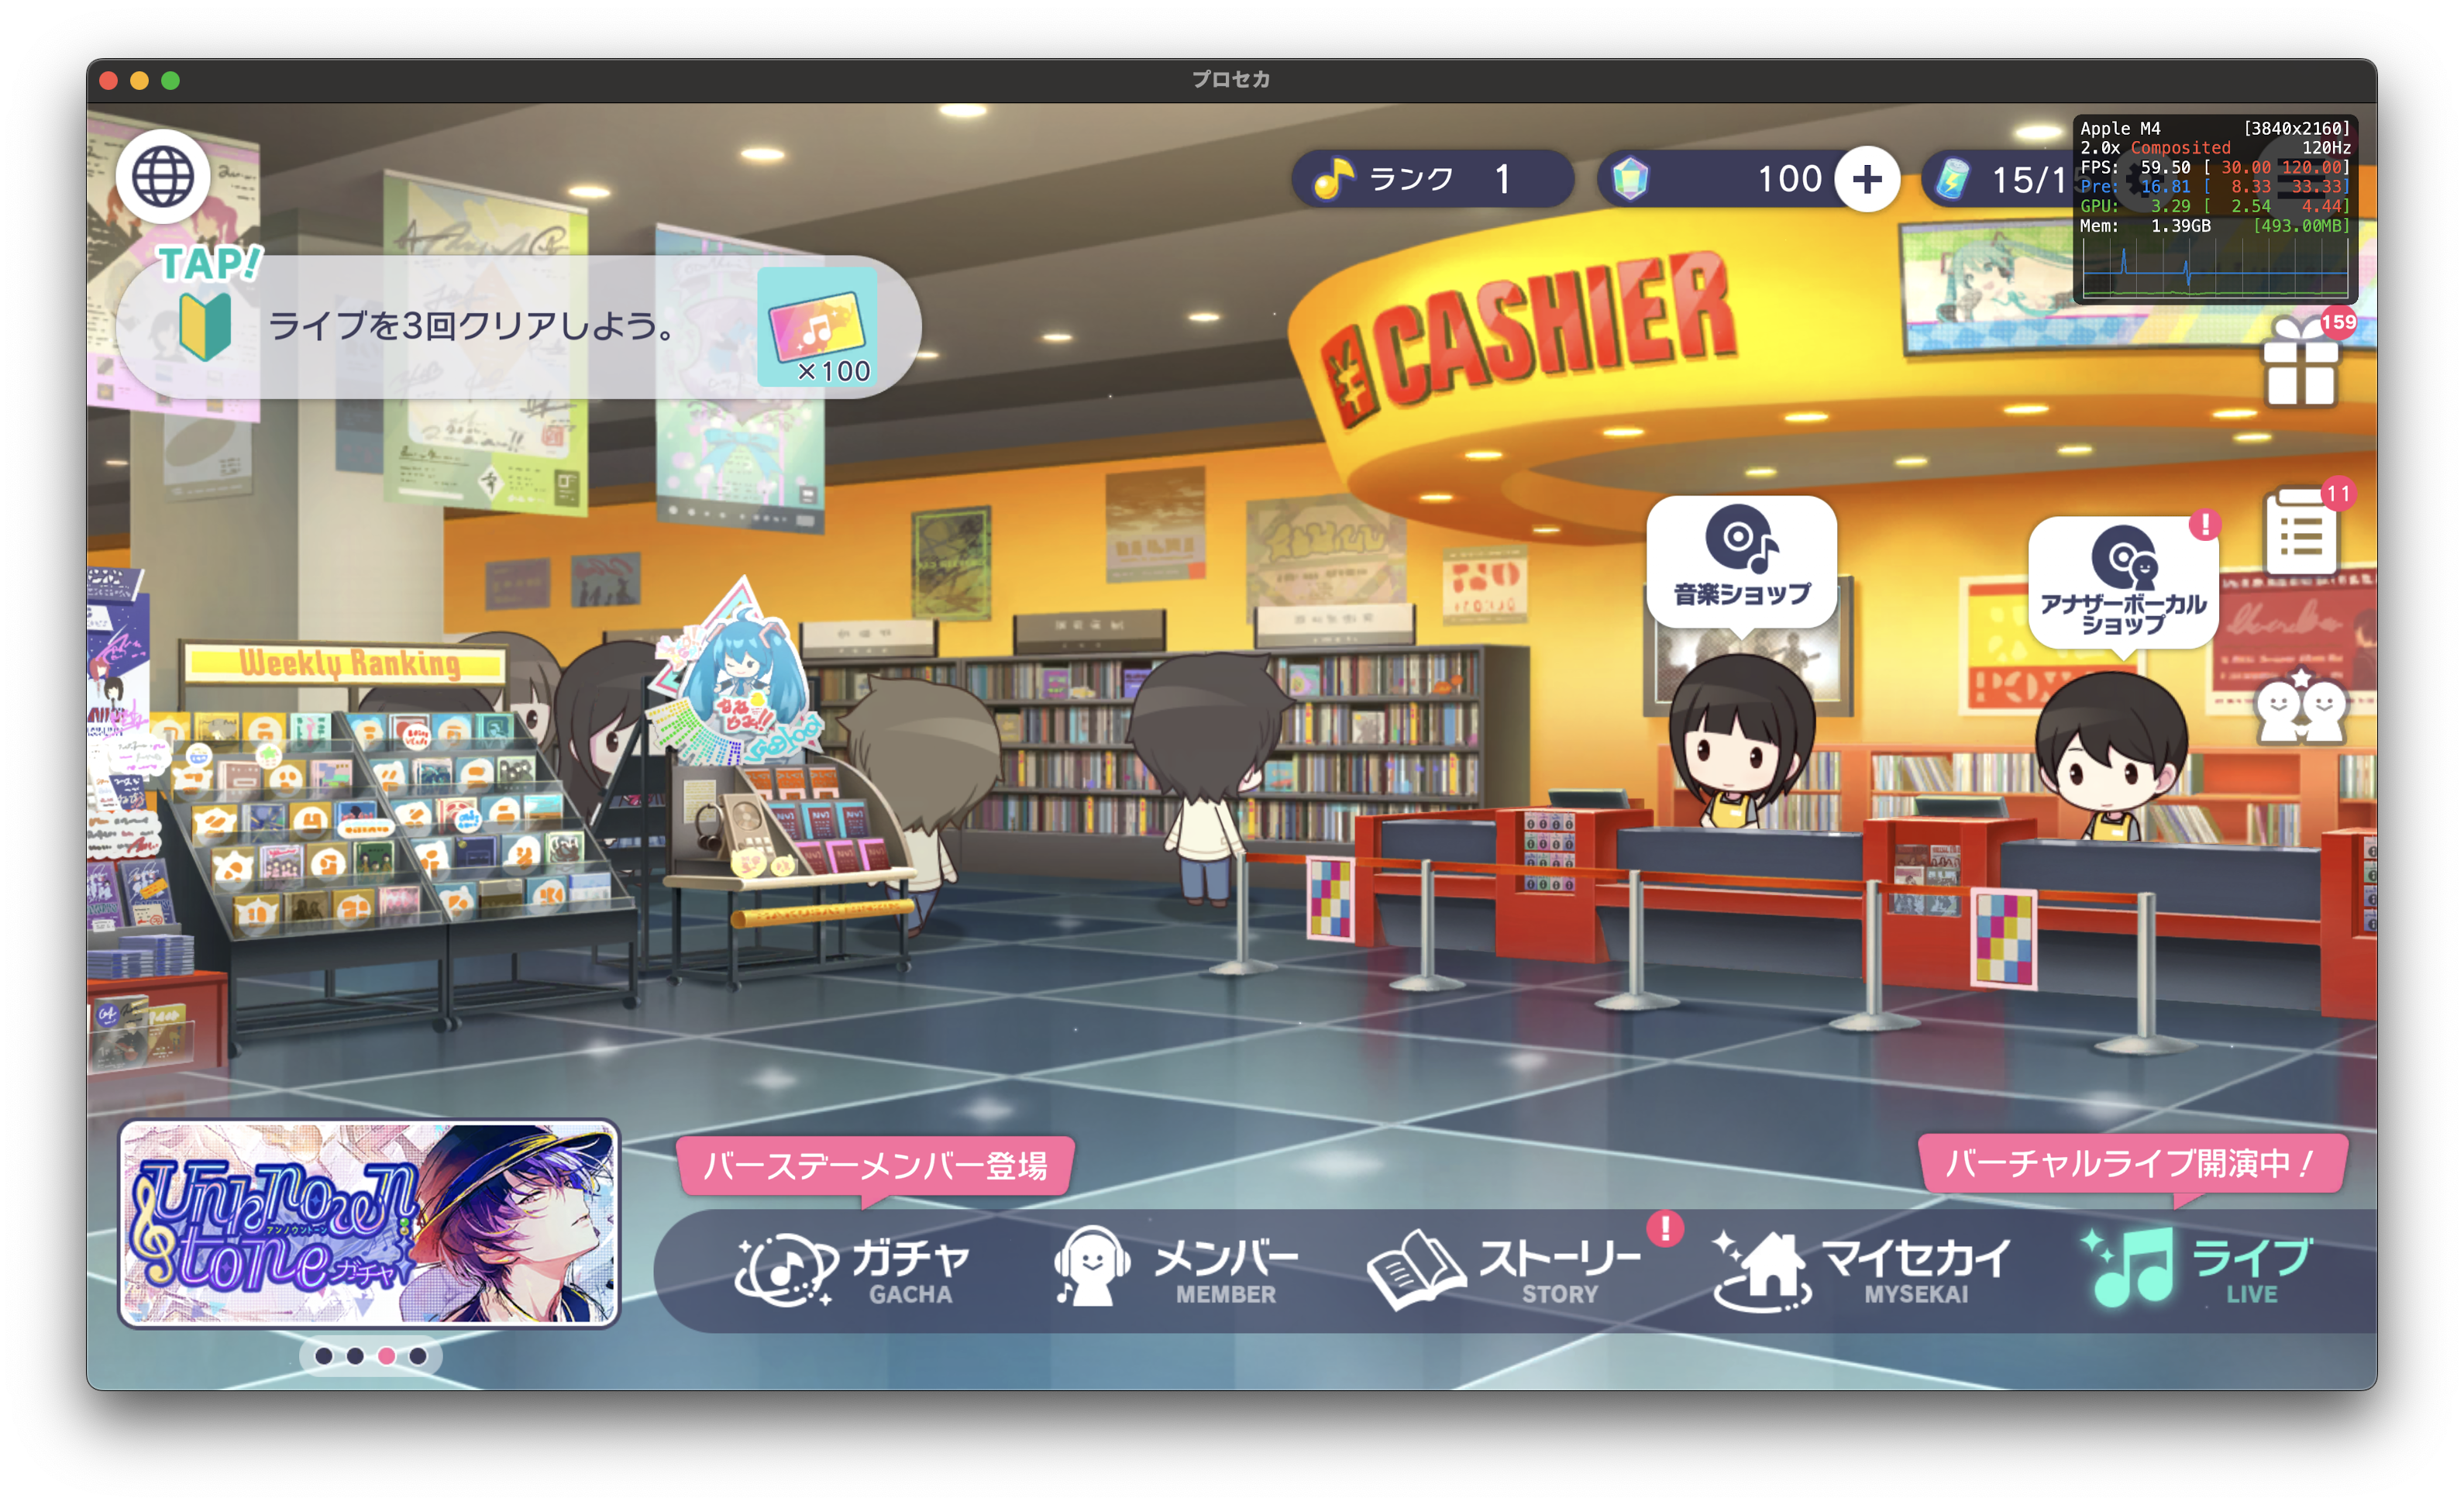
Enter 3D MV (脳內革命ガール - https://www.youtube.com/watch?v=ZKuk7PeBc0U,https://www.bilibili.com/video/BV1Xz4y147c1) after freeing FPS in the settings.

Native 4K 120… We are told at least two things here
- The Mac Mini (2024) is REALLY good 😋
- As with most mobile games - the pipeline is rather basic; it feels like you’re picking on a soft target ()
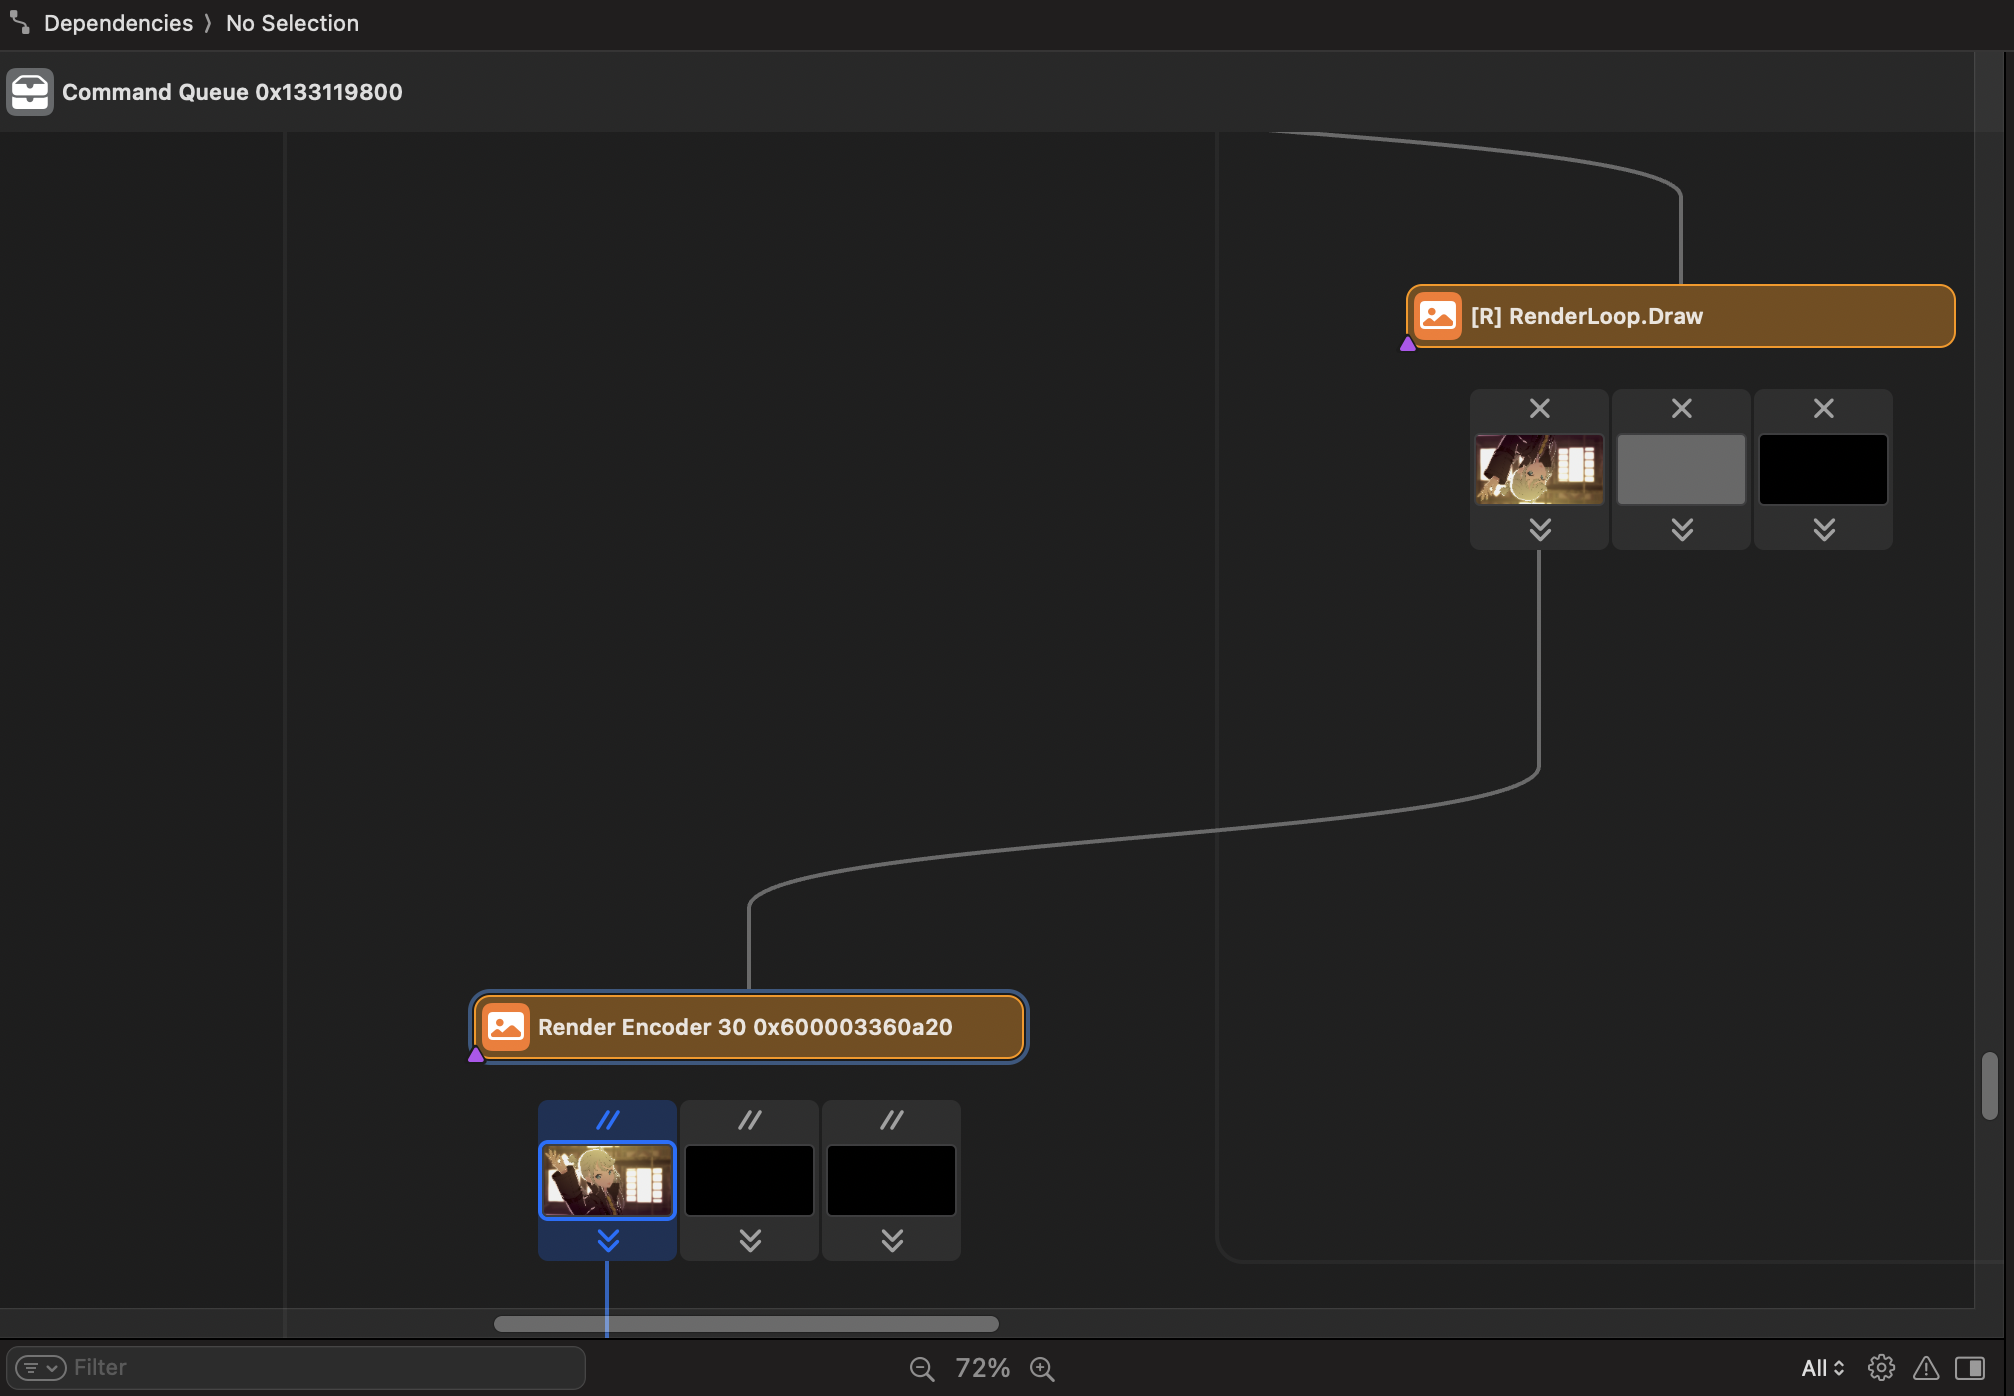
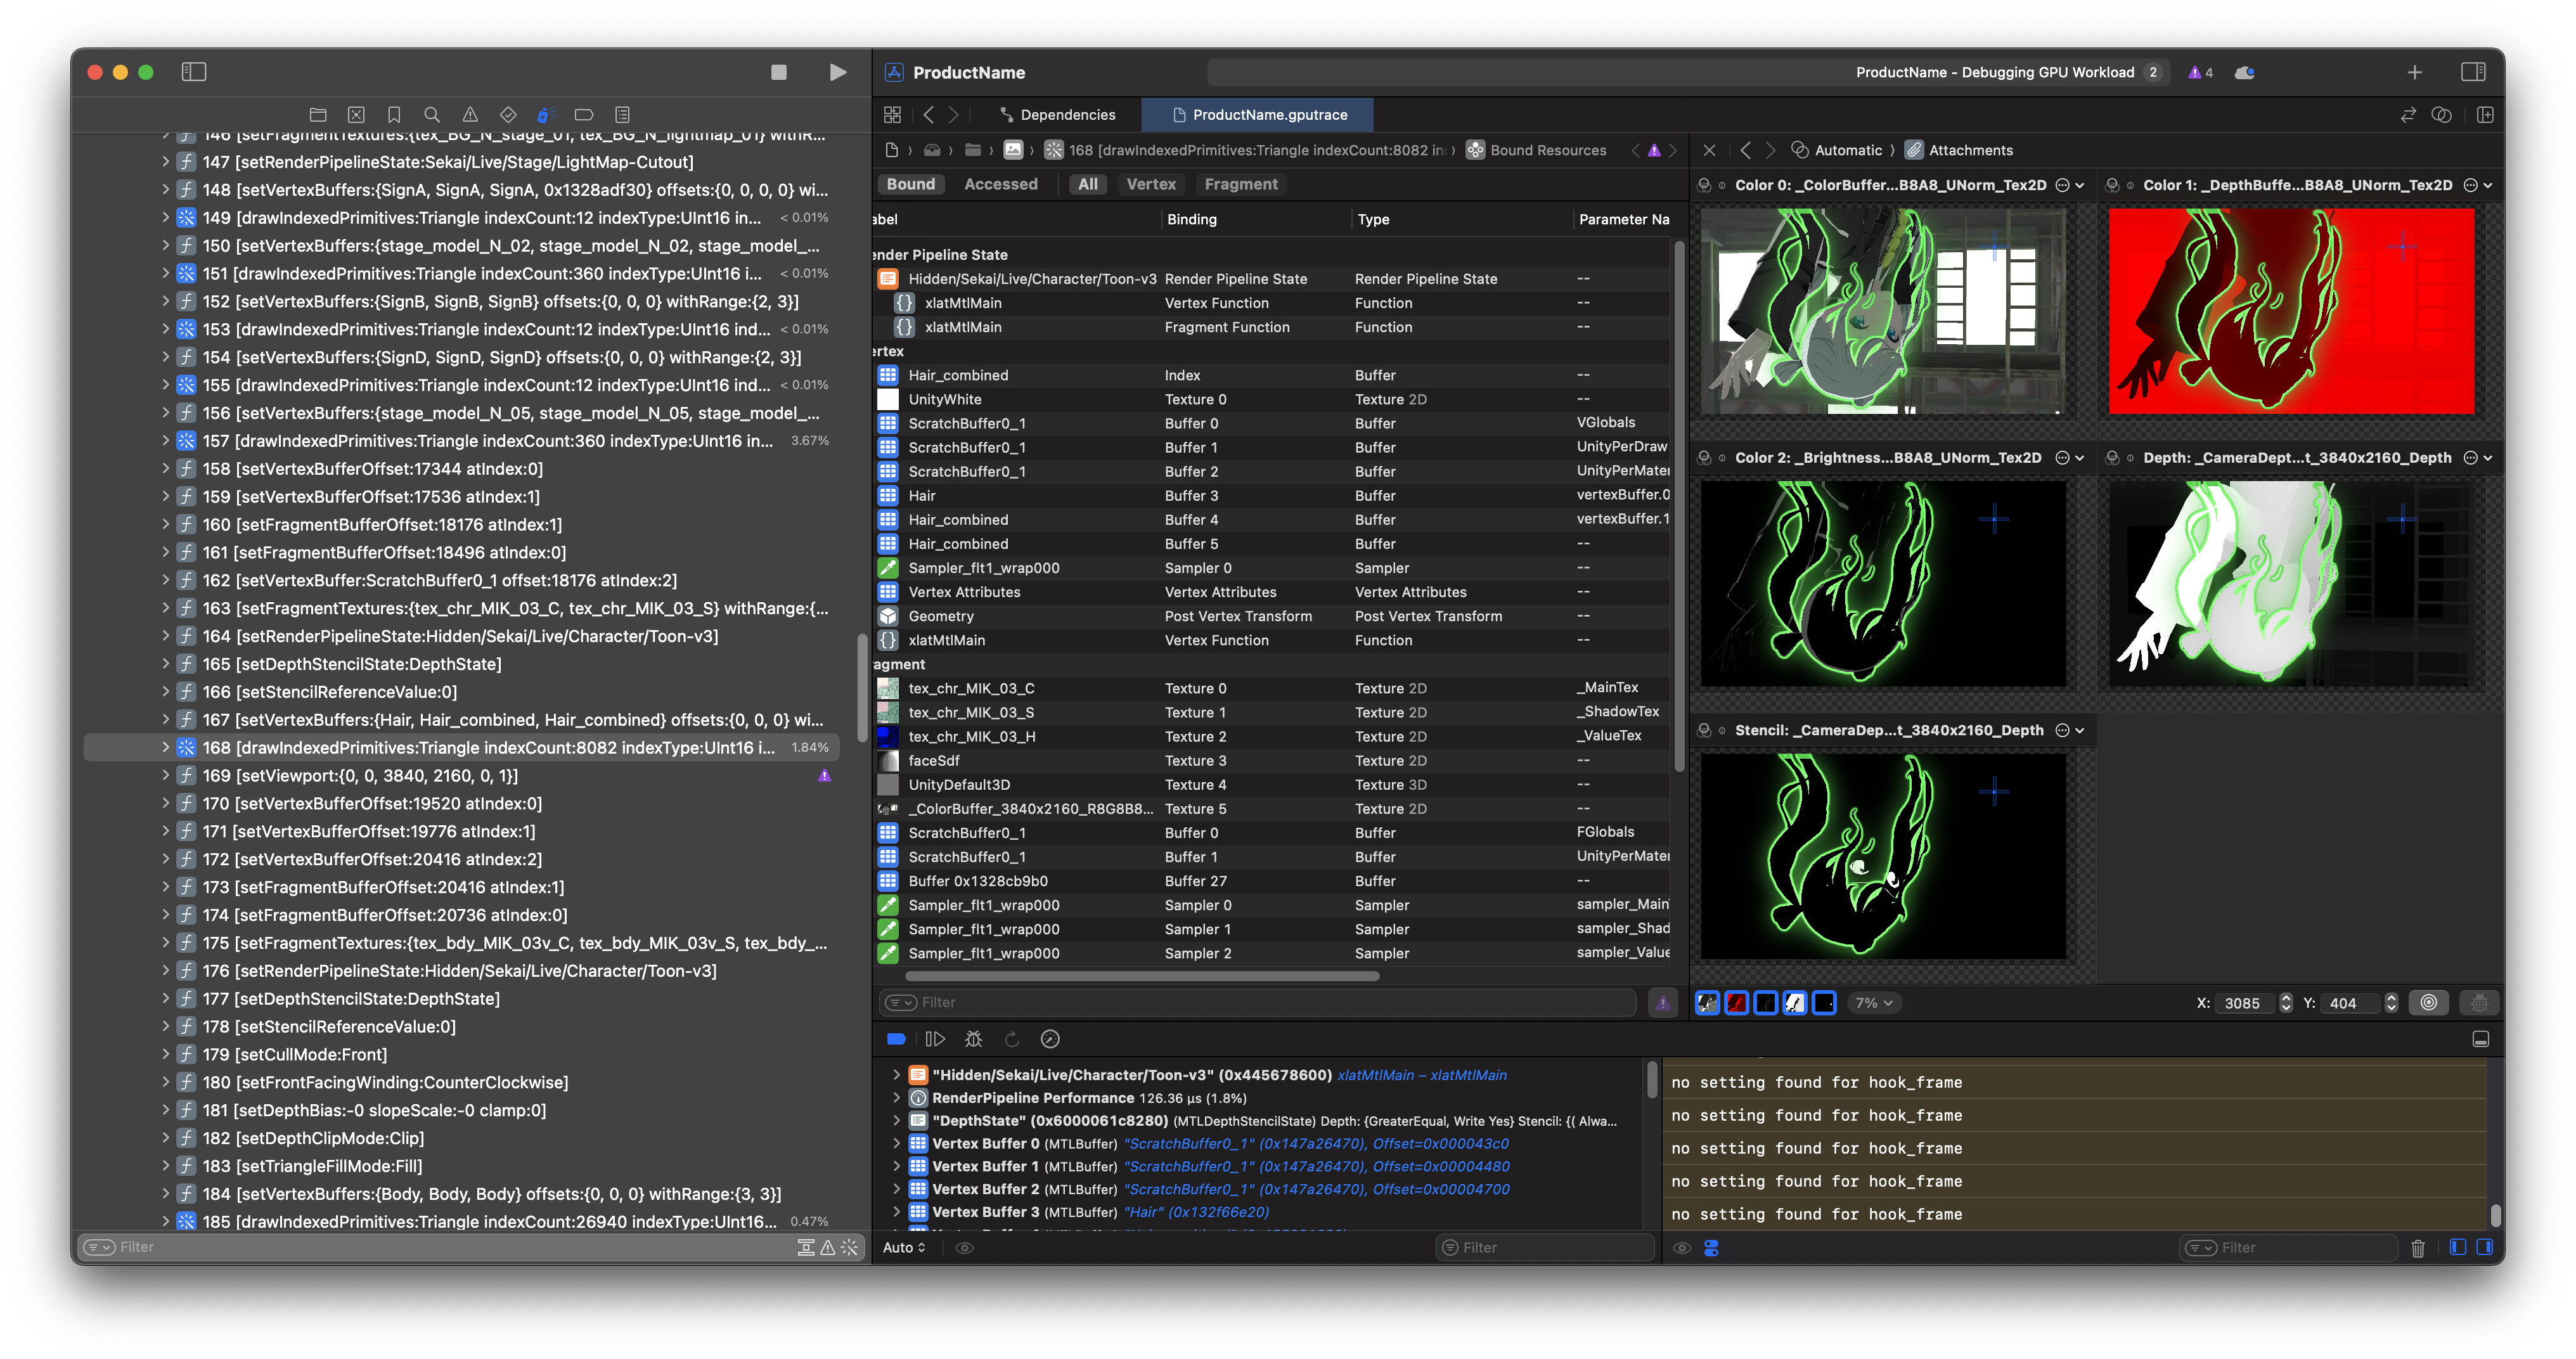
2. GPU capture!
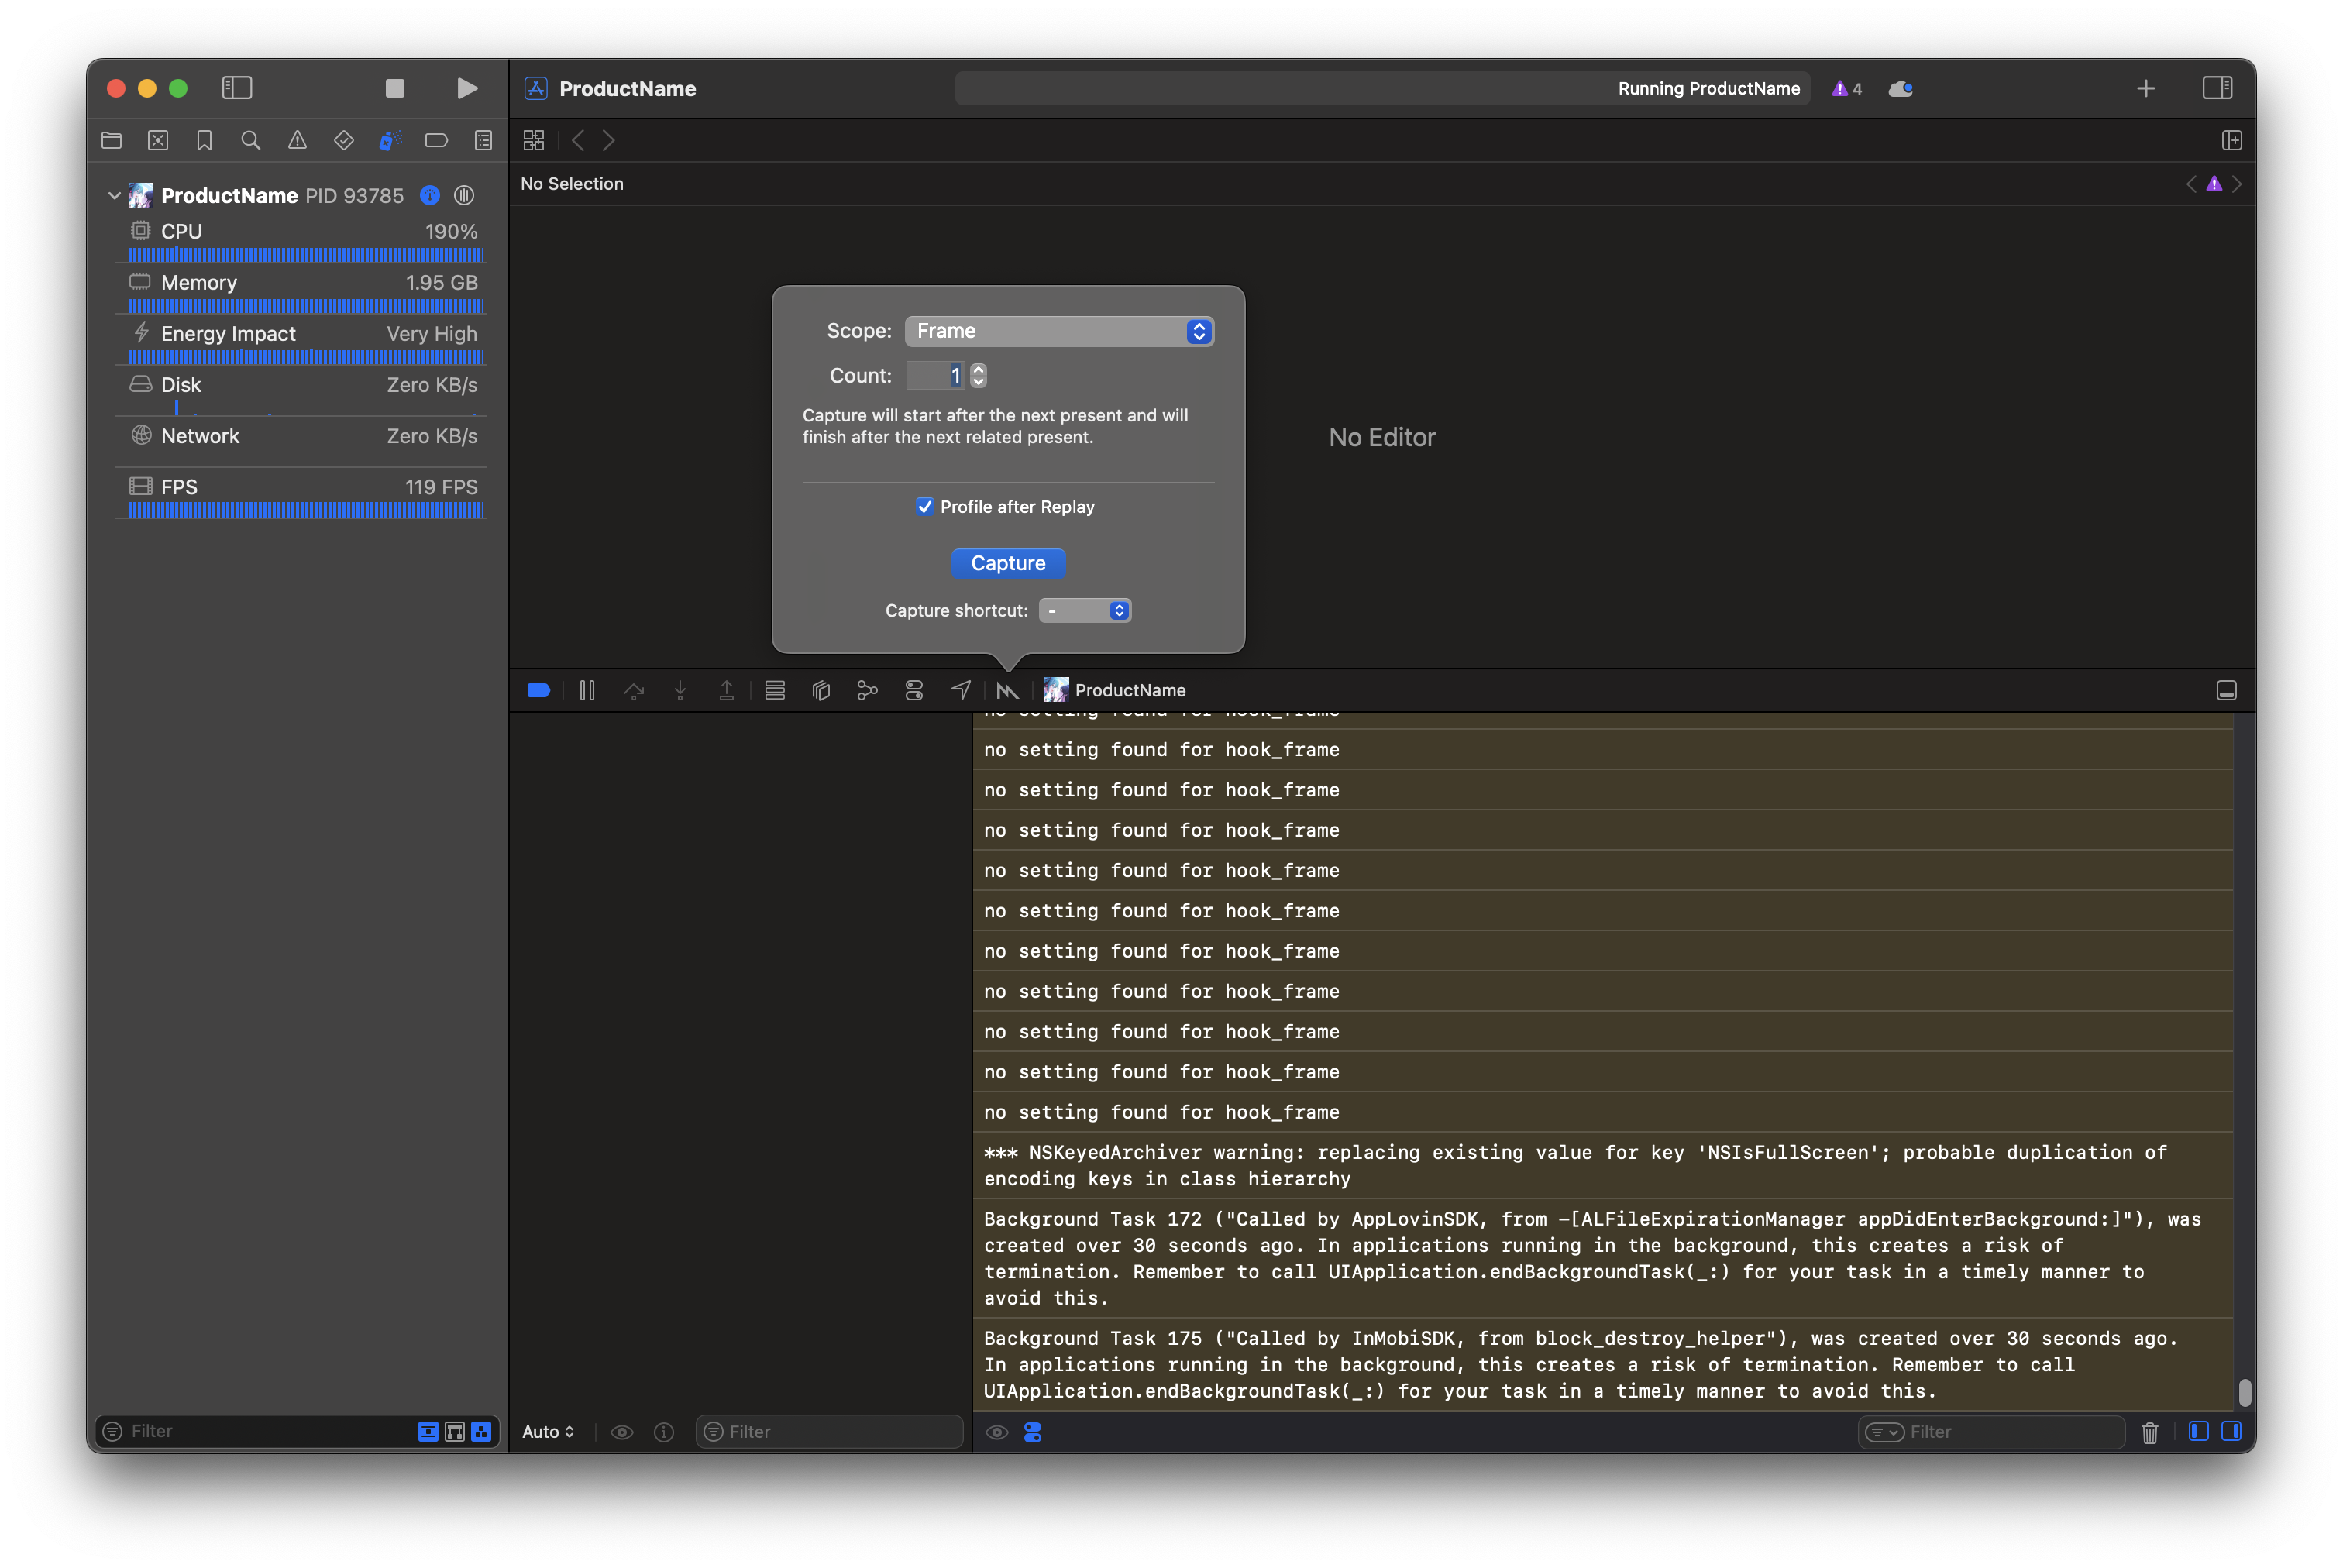
Interestingly PJSK doesn’t pause the rendering thread when pausing the 3D PV previews
Just tap the screen to come back to capture, press Capture.
Note: Profile after Replay can be turned off to speed up shader editing.
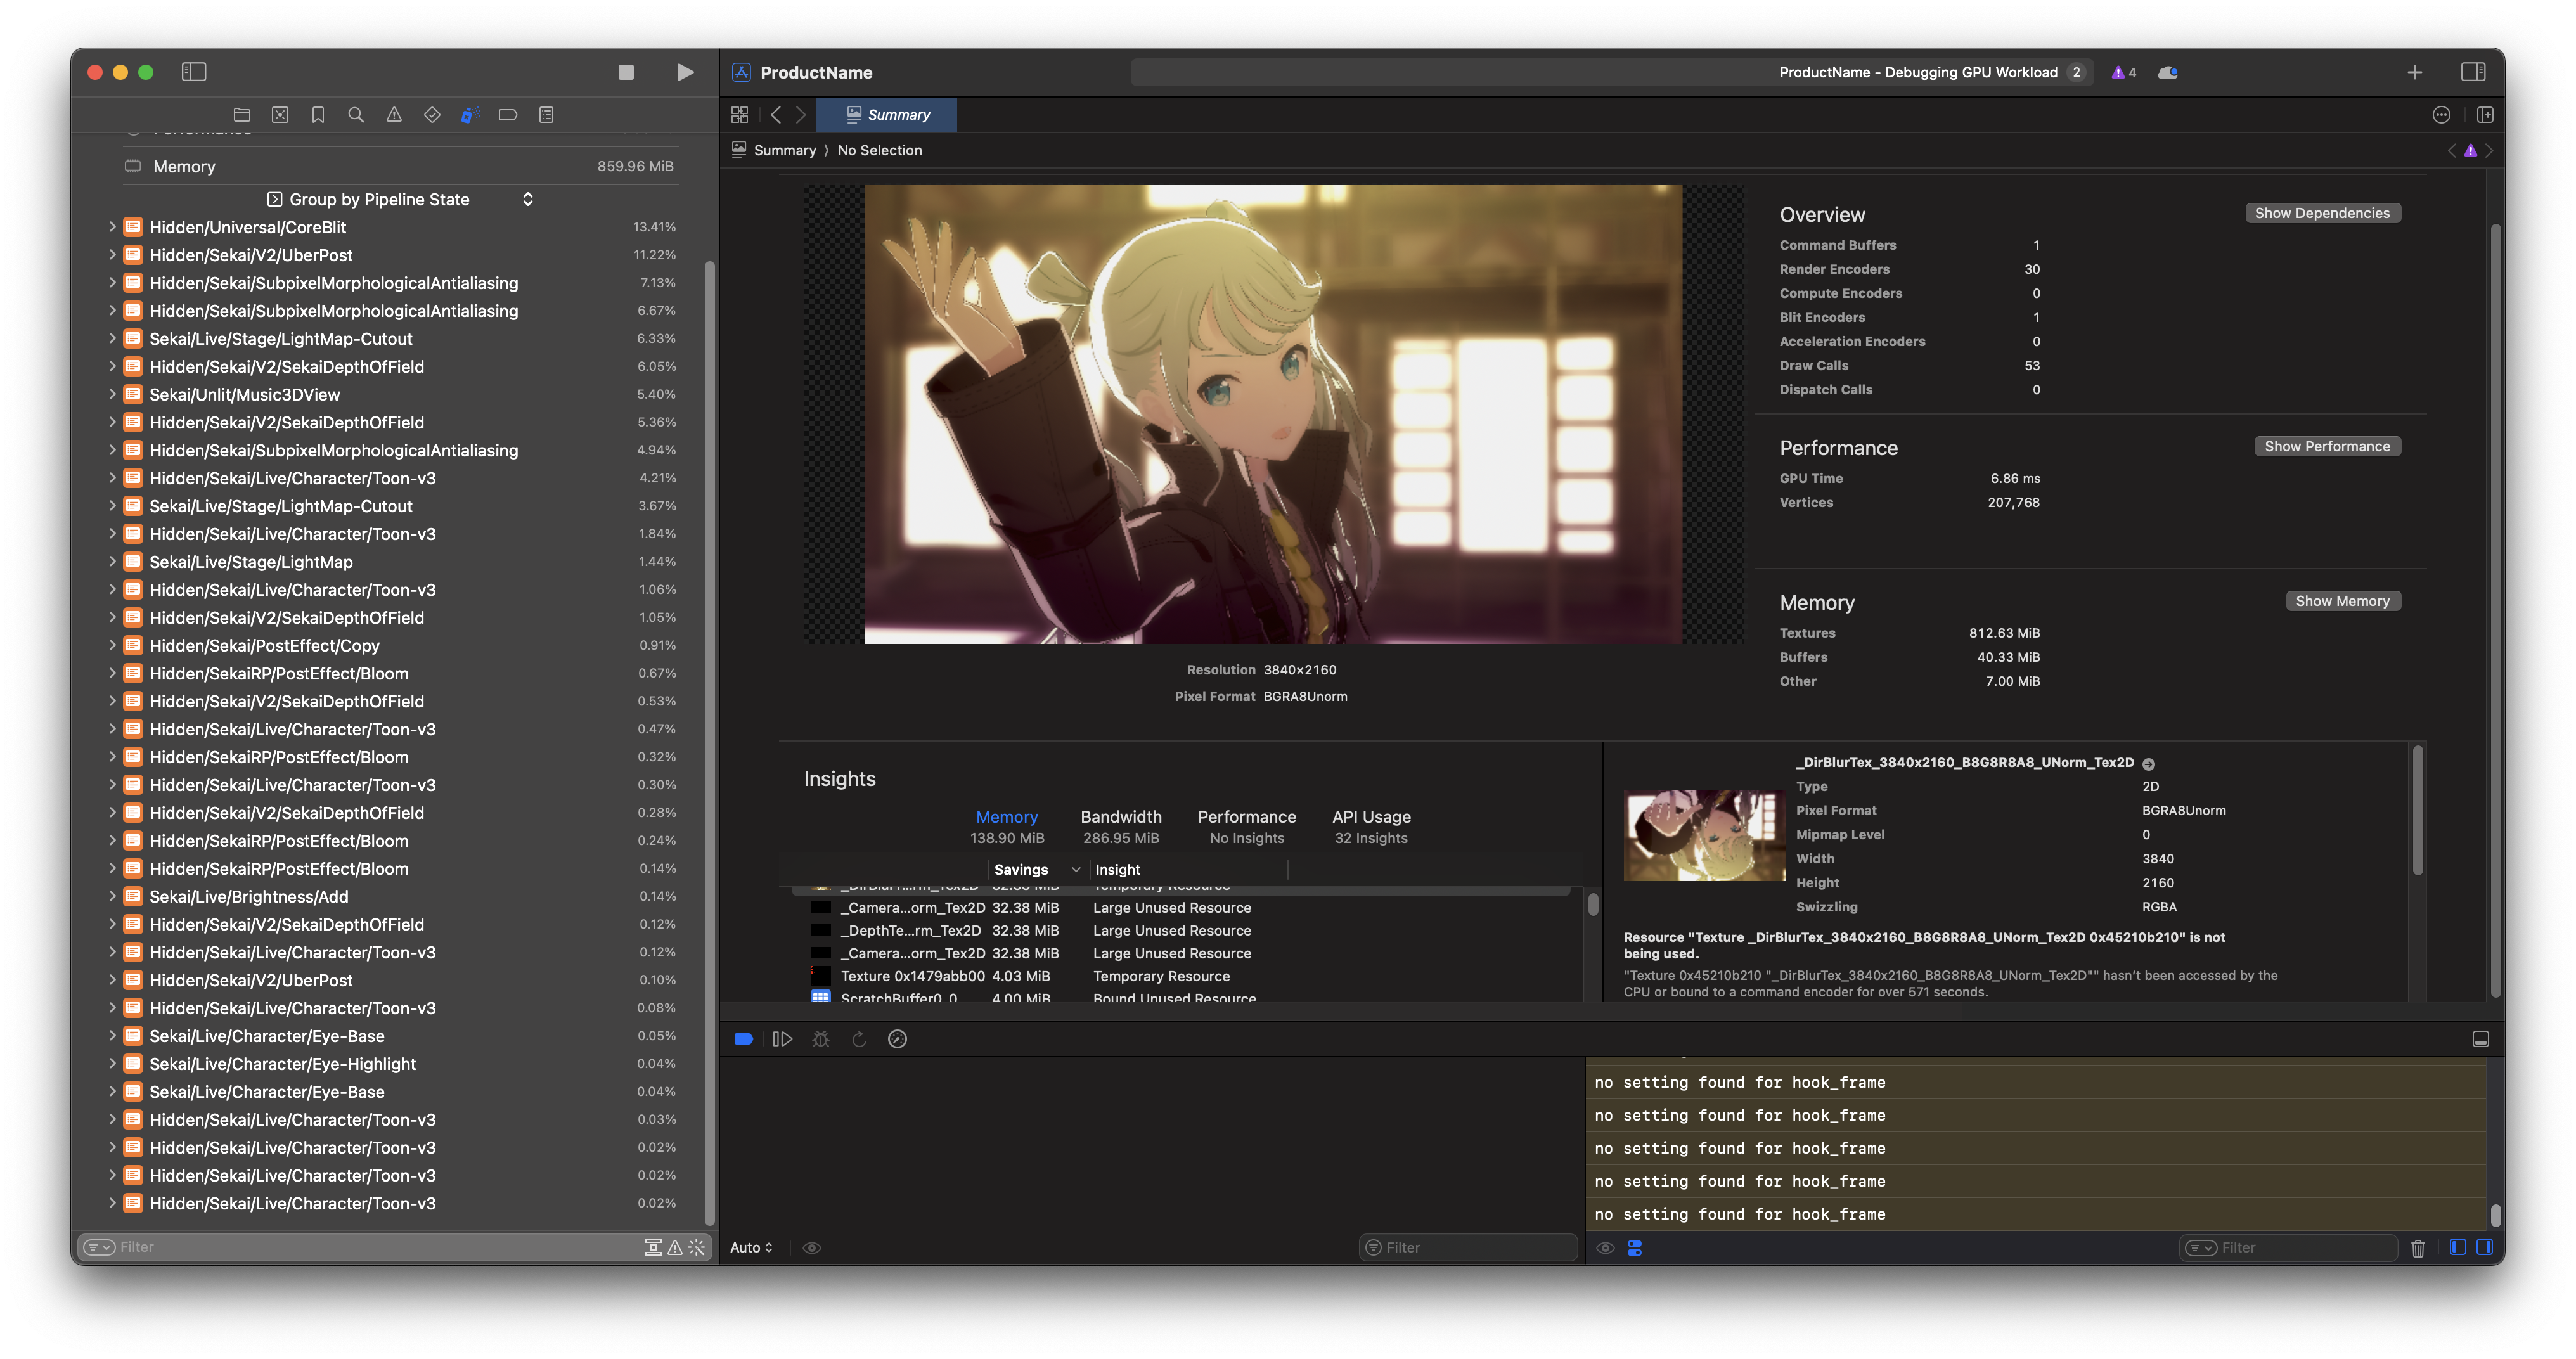
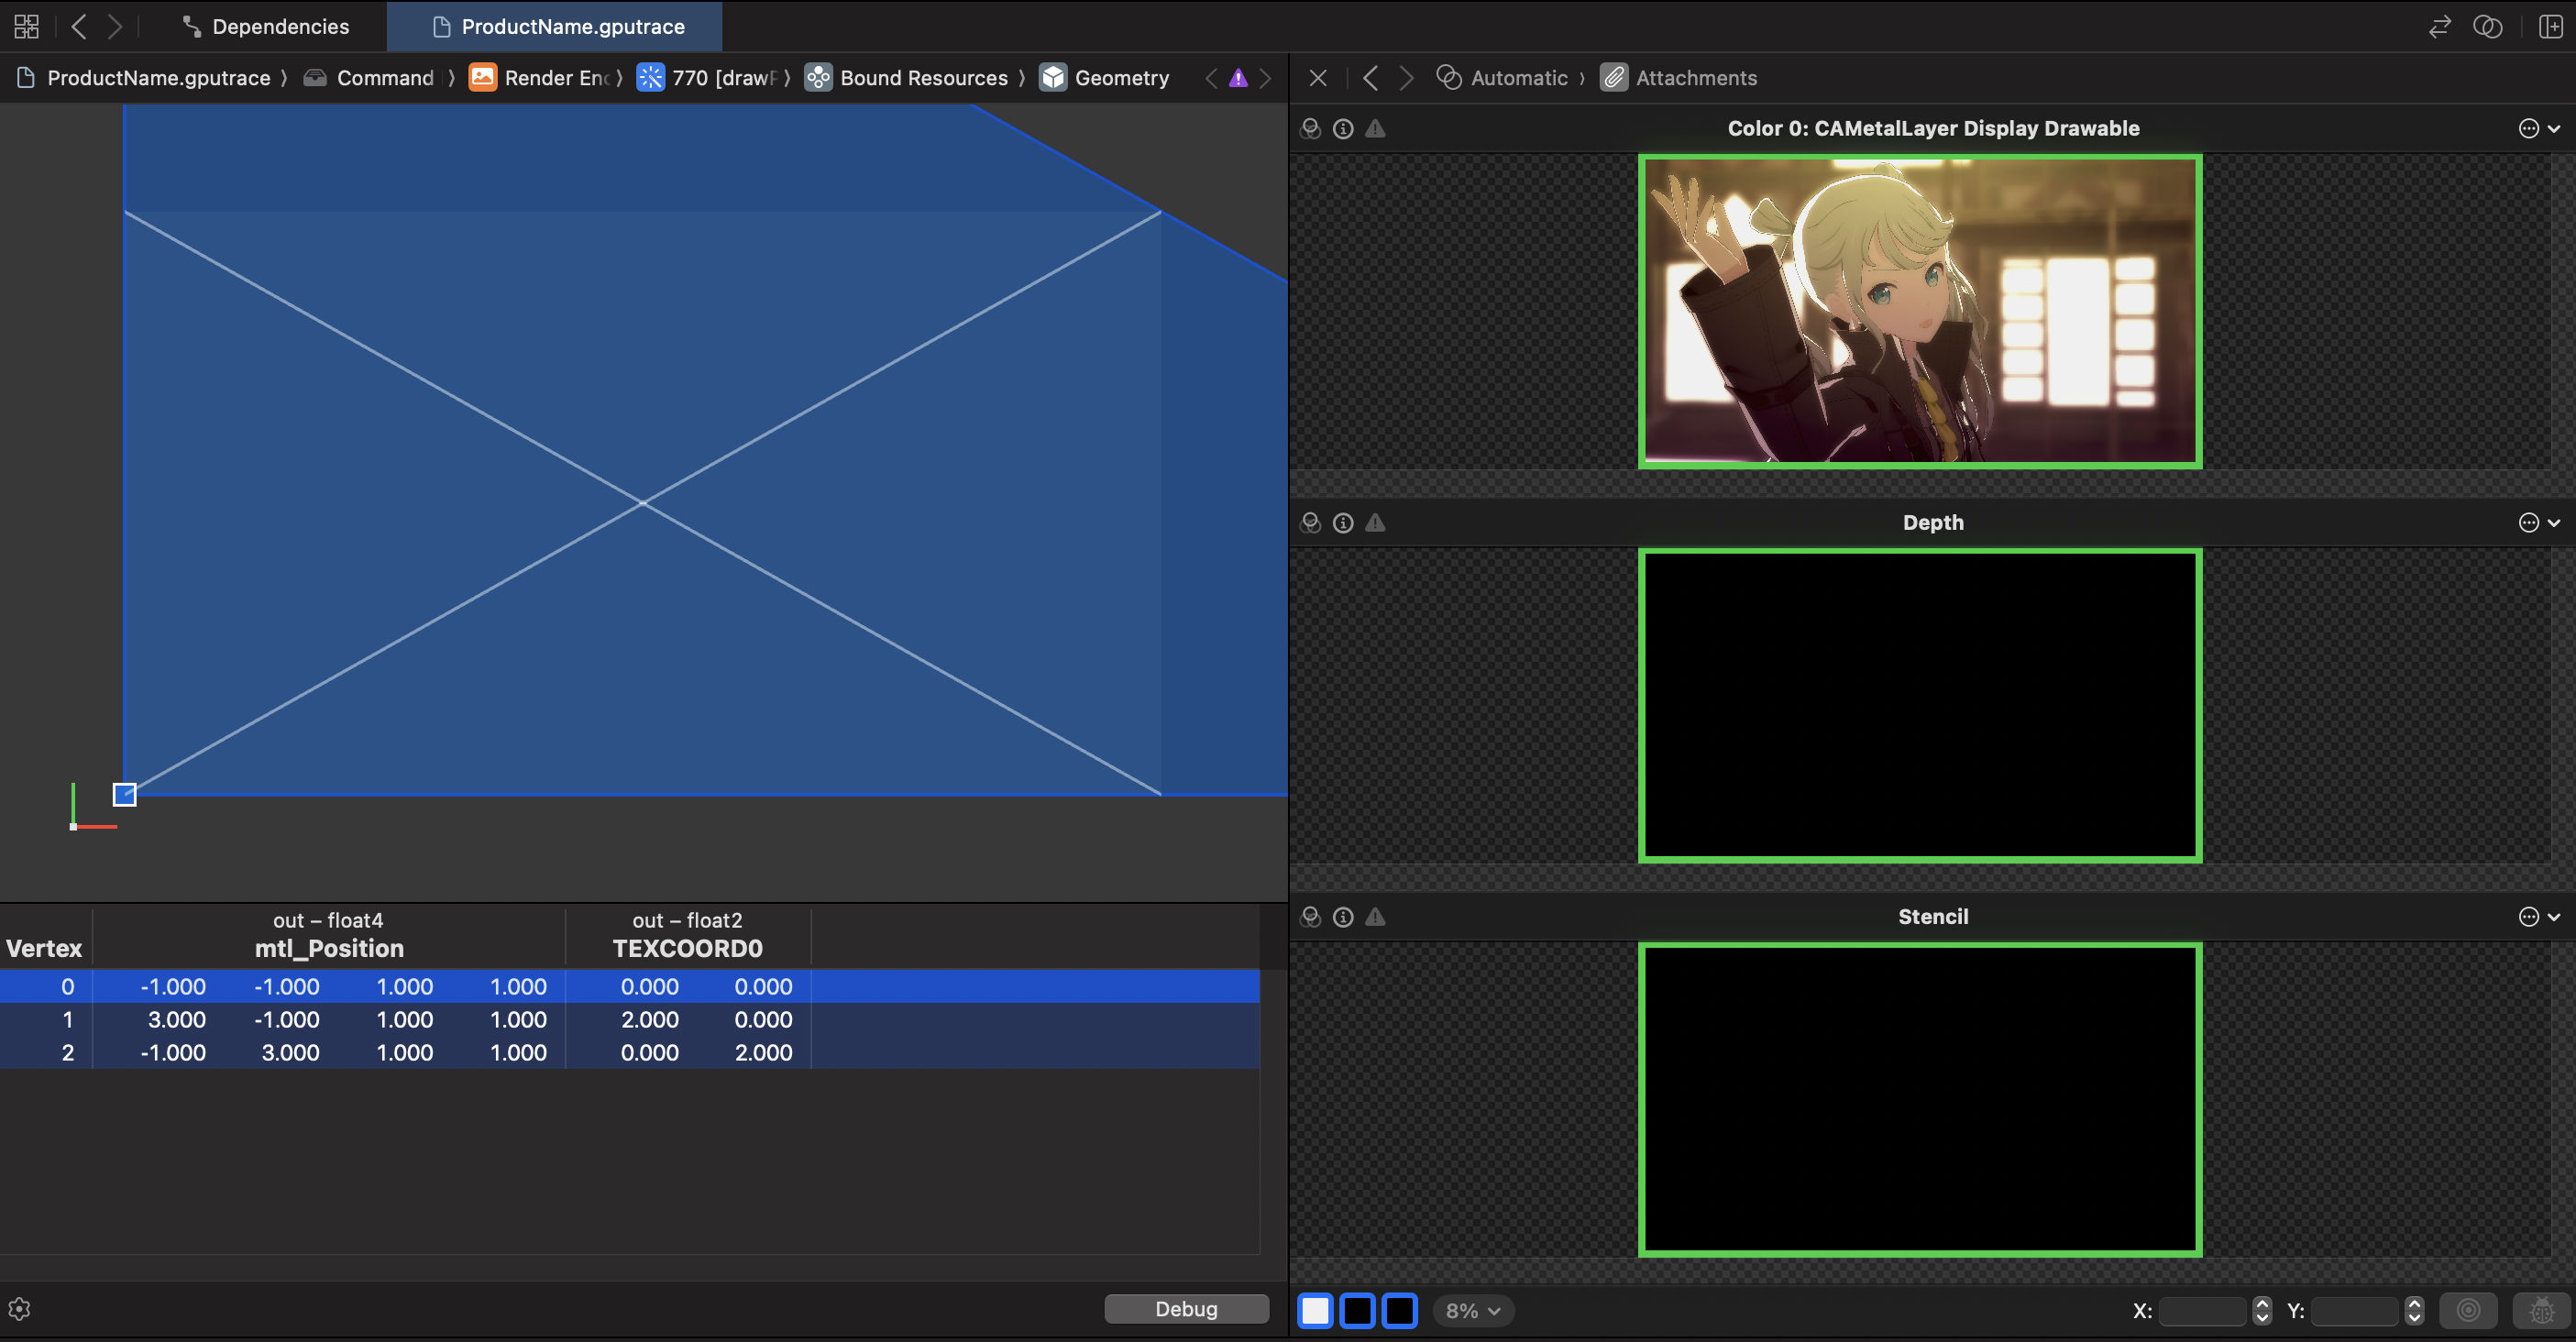
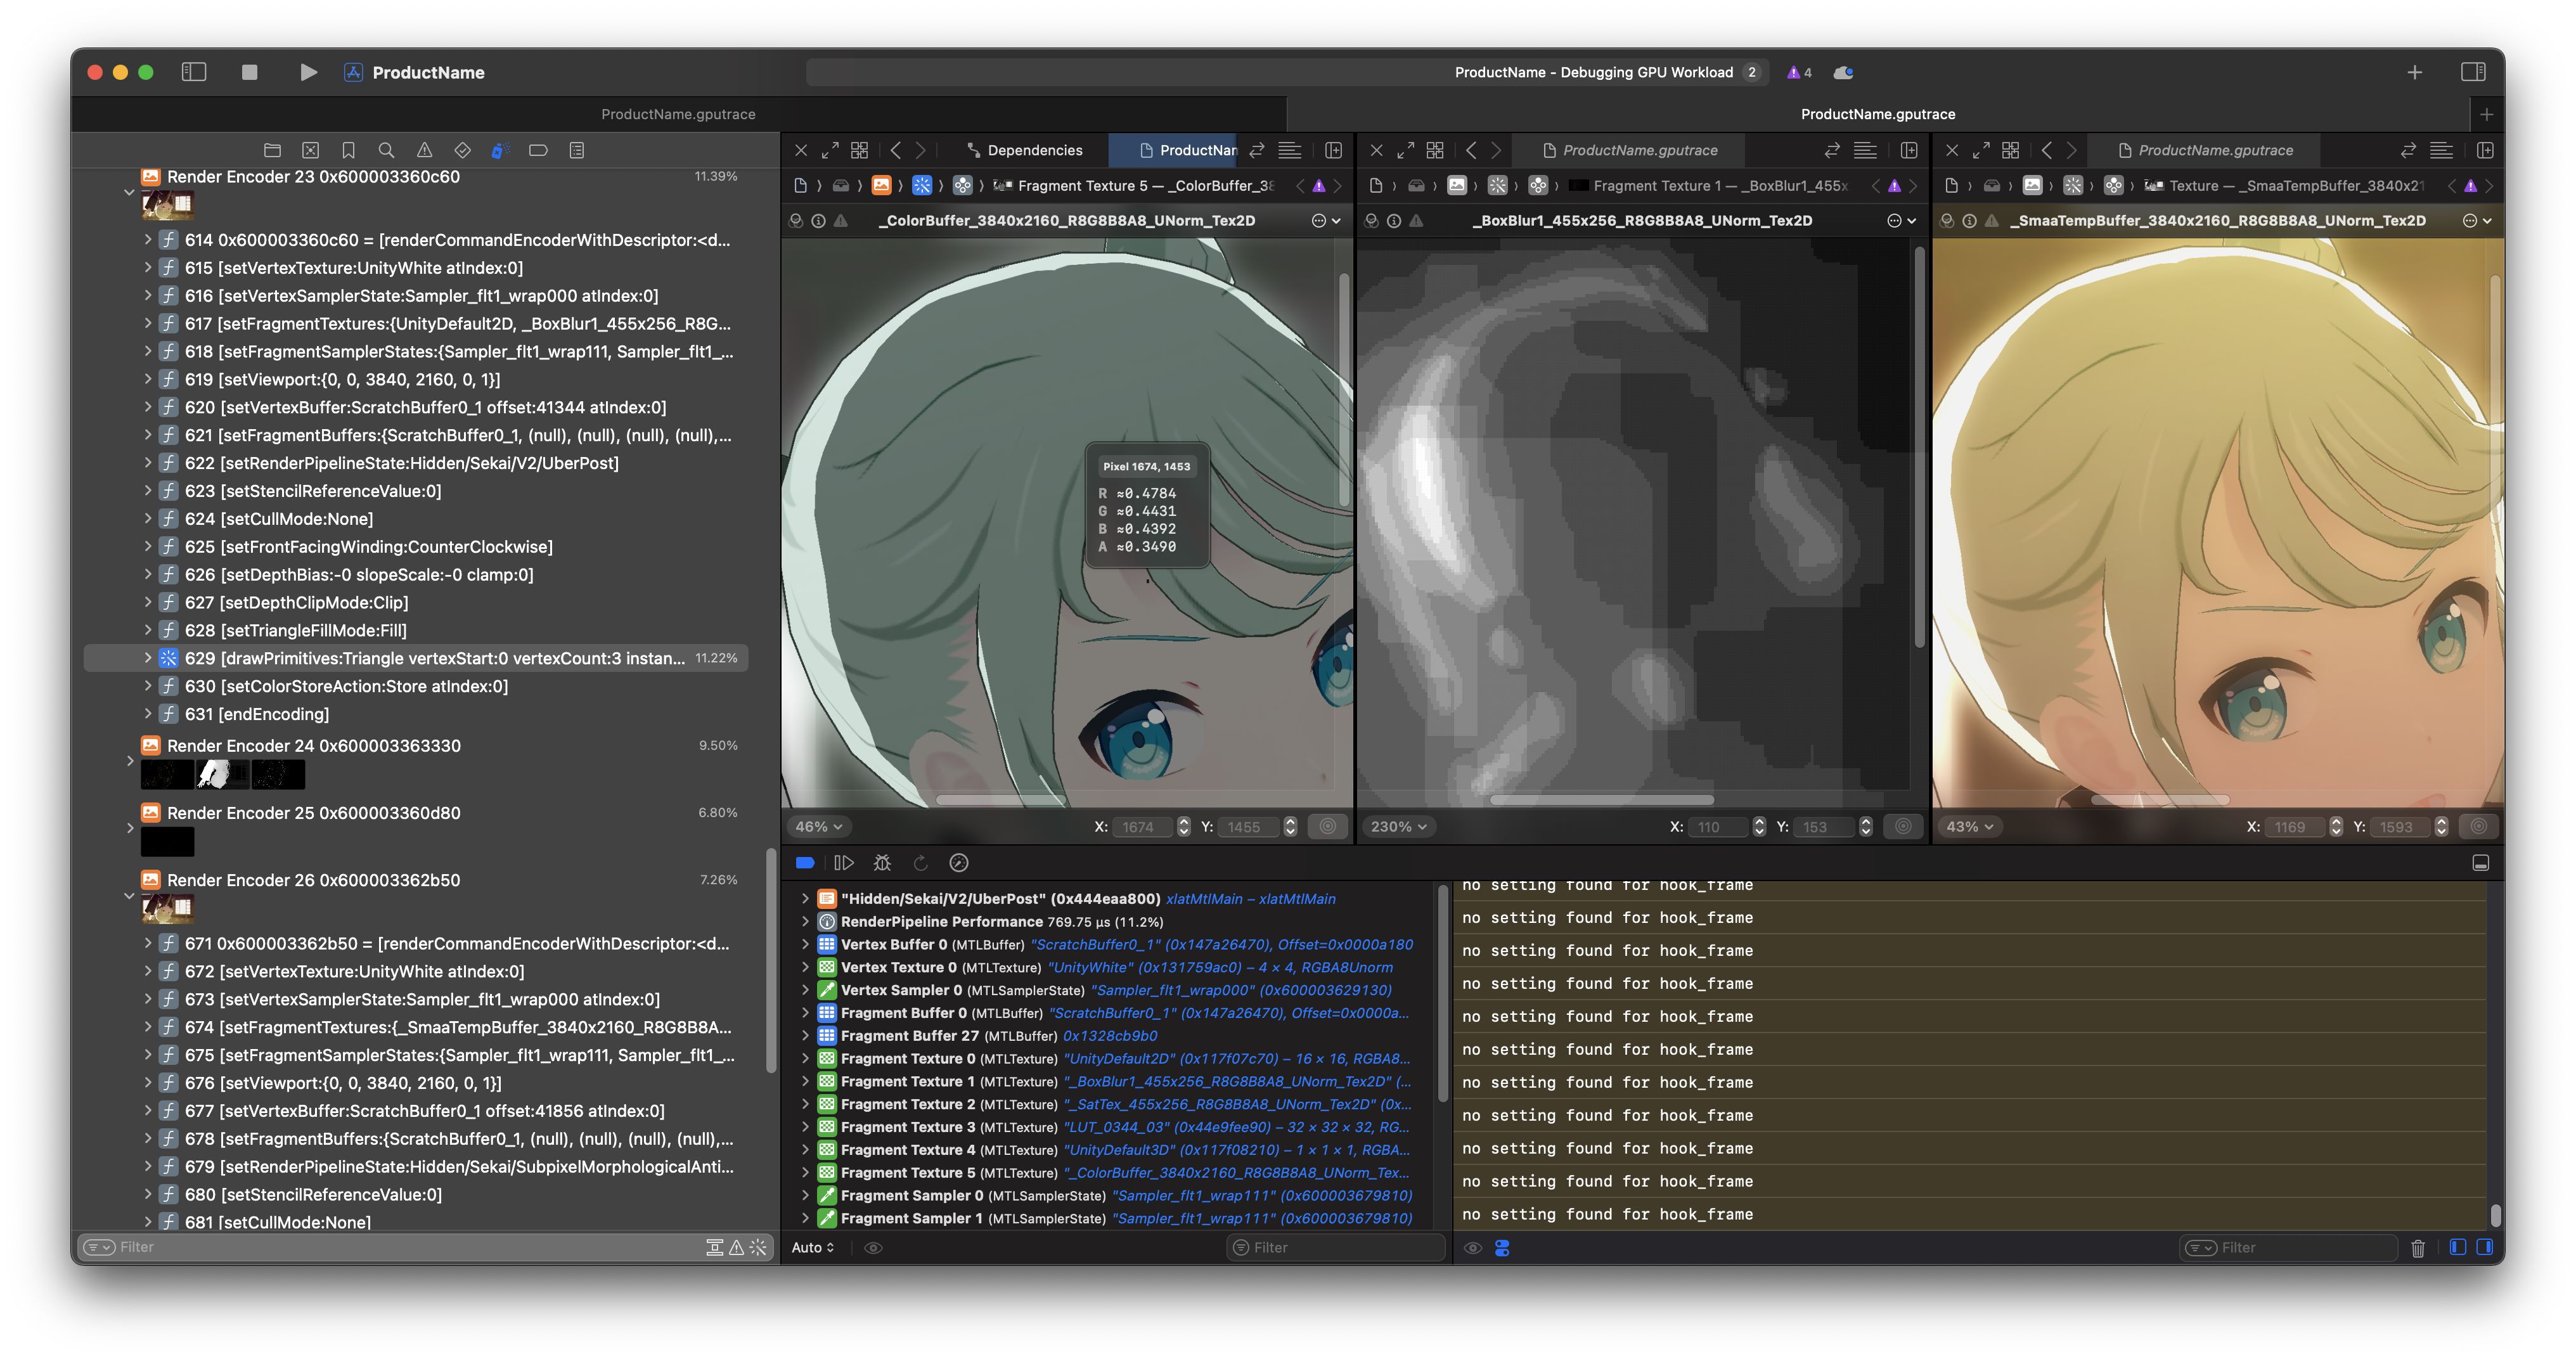
Pass is in full view… ¶¶It’s quite a sight to behold. ¶¶
Some observations
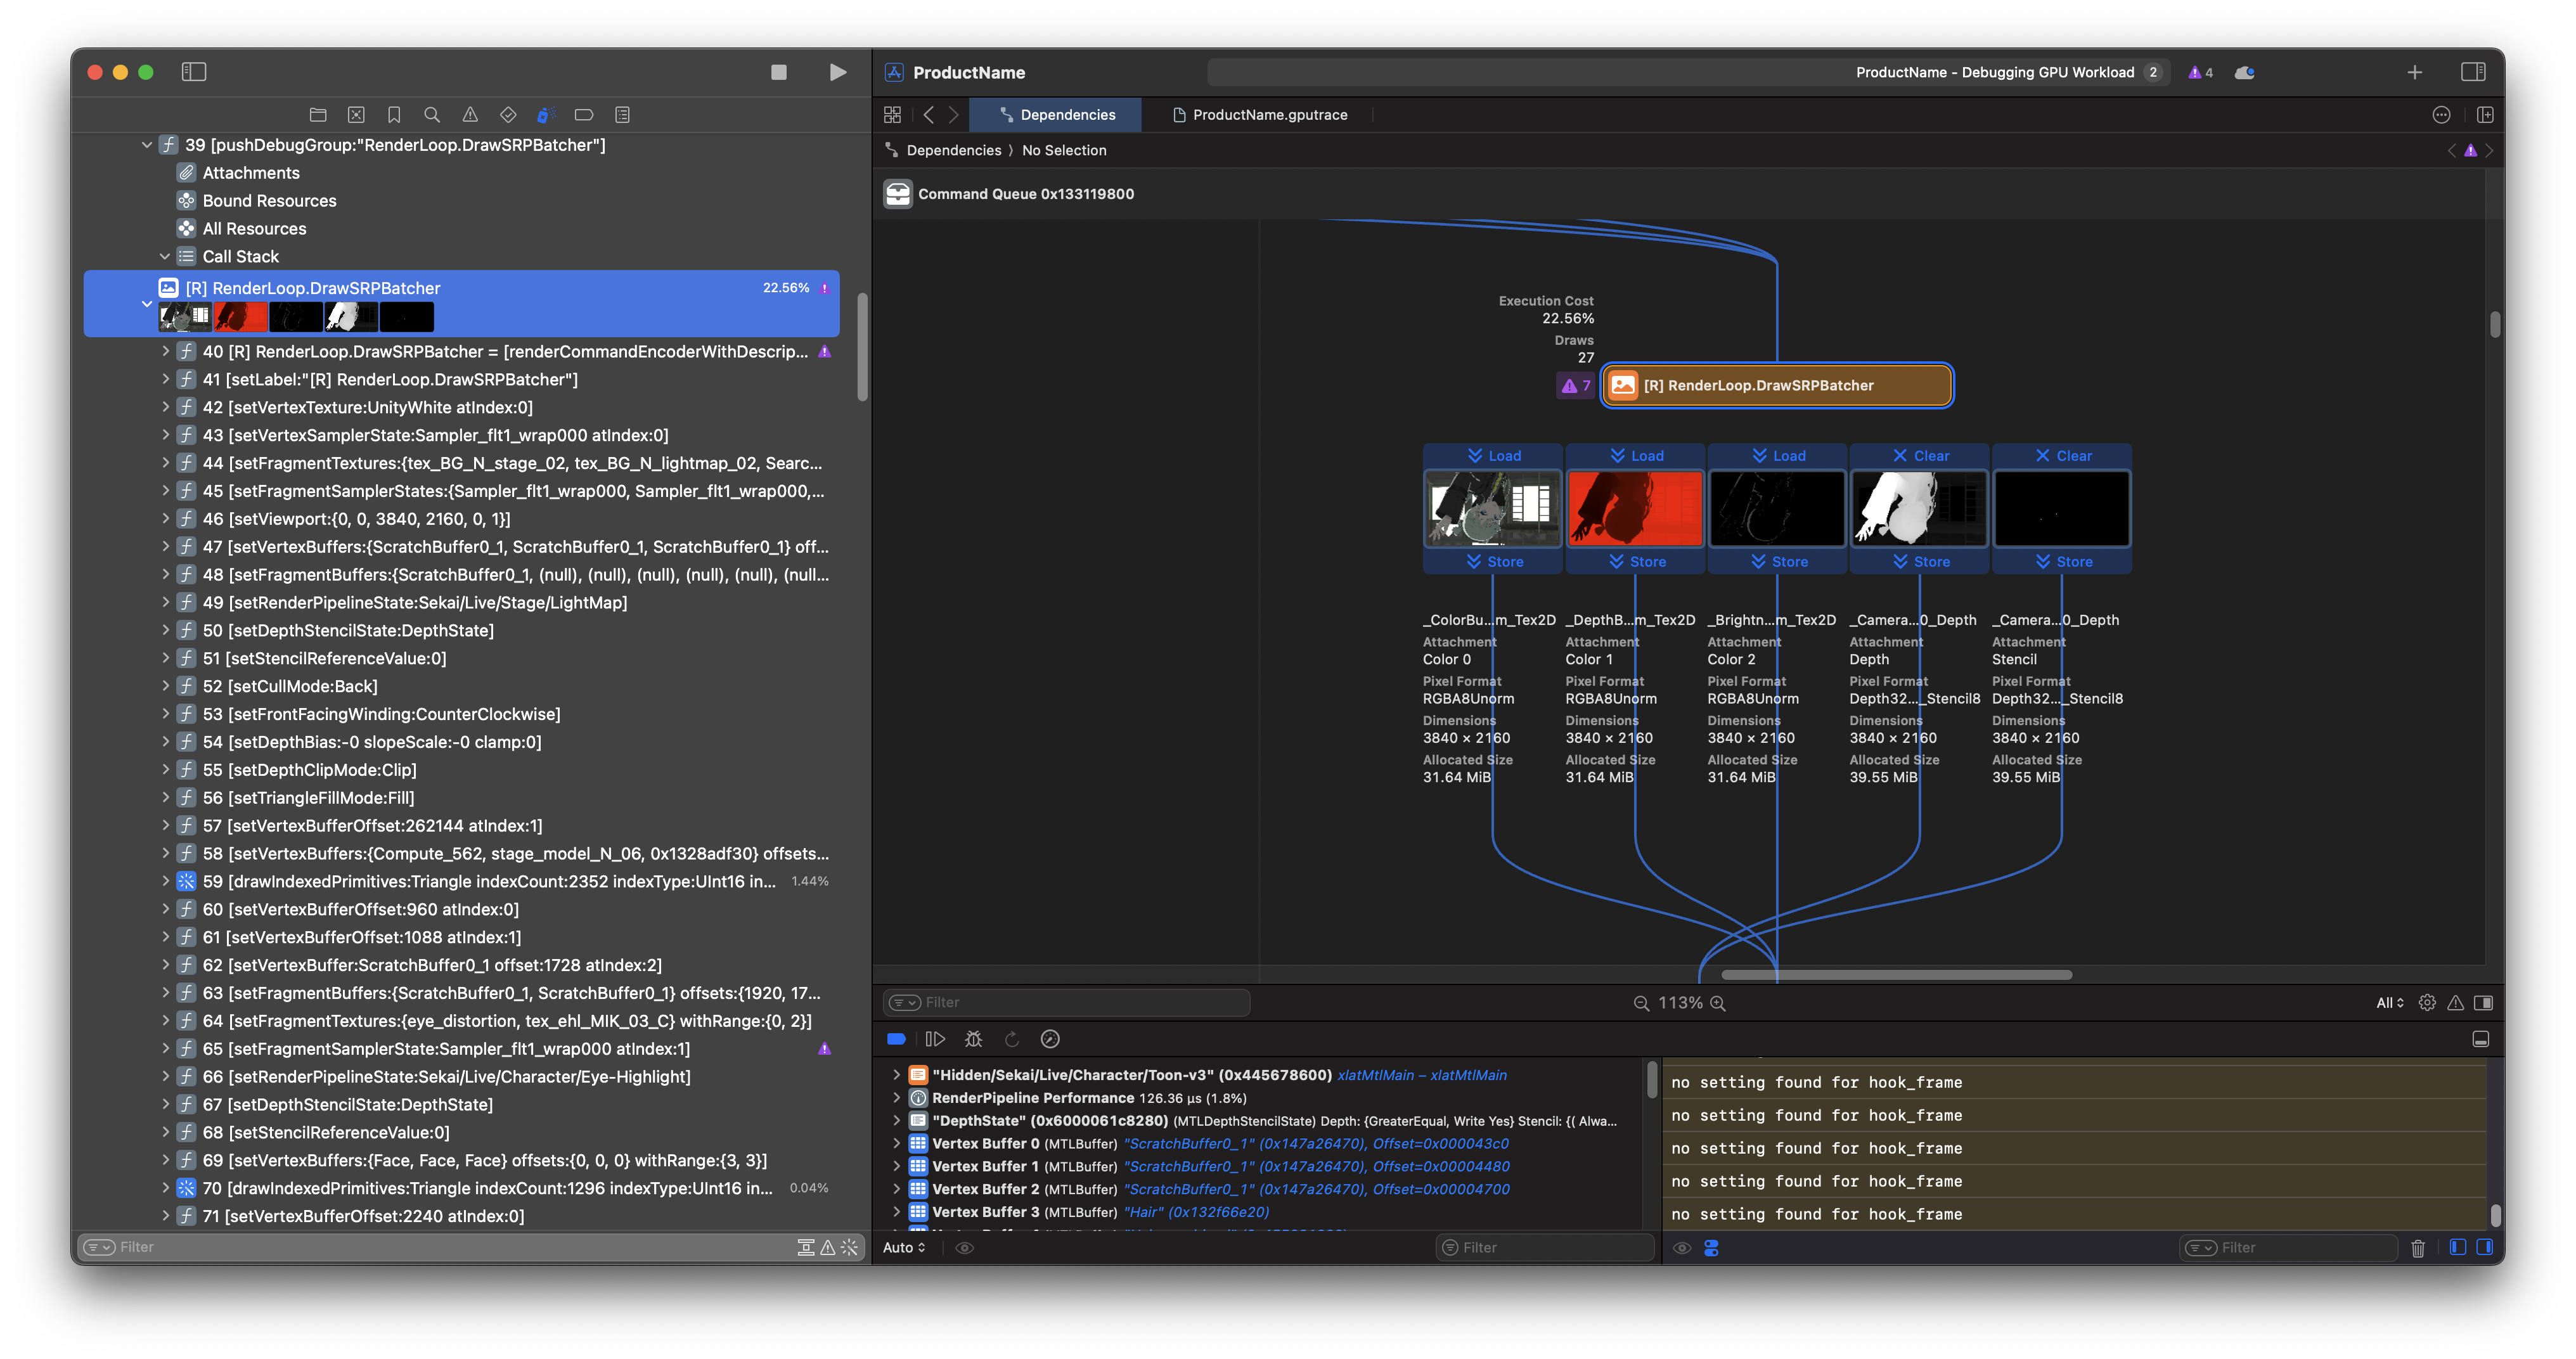
Present flip
You can notice that the graphics in the pipeline are flipped up and down, here it has something to do with Metal’s NDC space
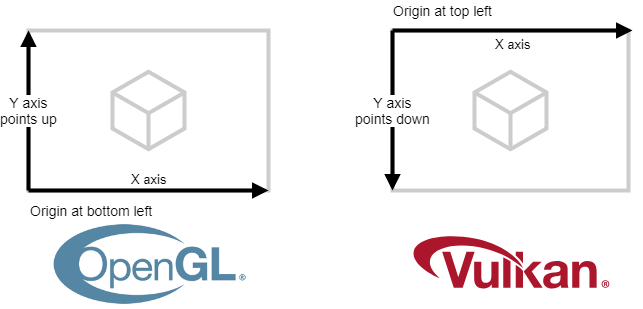
Metal and Vulkan similar, positive $Y$-axis facing down after emulation

In terms of fixing this, it is possible to flip all the affine $Y$-axes in the Vertex shader (e.g., by directly transforming the $P$ of the $PVM$ matrix).
Unity doesn’t do that, though, and adds a Flip pass before Present…
…Reverse UV reblit all over again; considering the amount of shader the user would otherwise need to modify by hand seems inexcusable?
Render mode
Game still uses classic Forward Rendering, not the new TBDR; looks like URP supports the latter?
But it’s clear that what’s being used here is actually an SRP
3. A Brief Look At Post-Processing
DoF
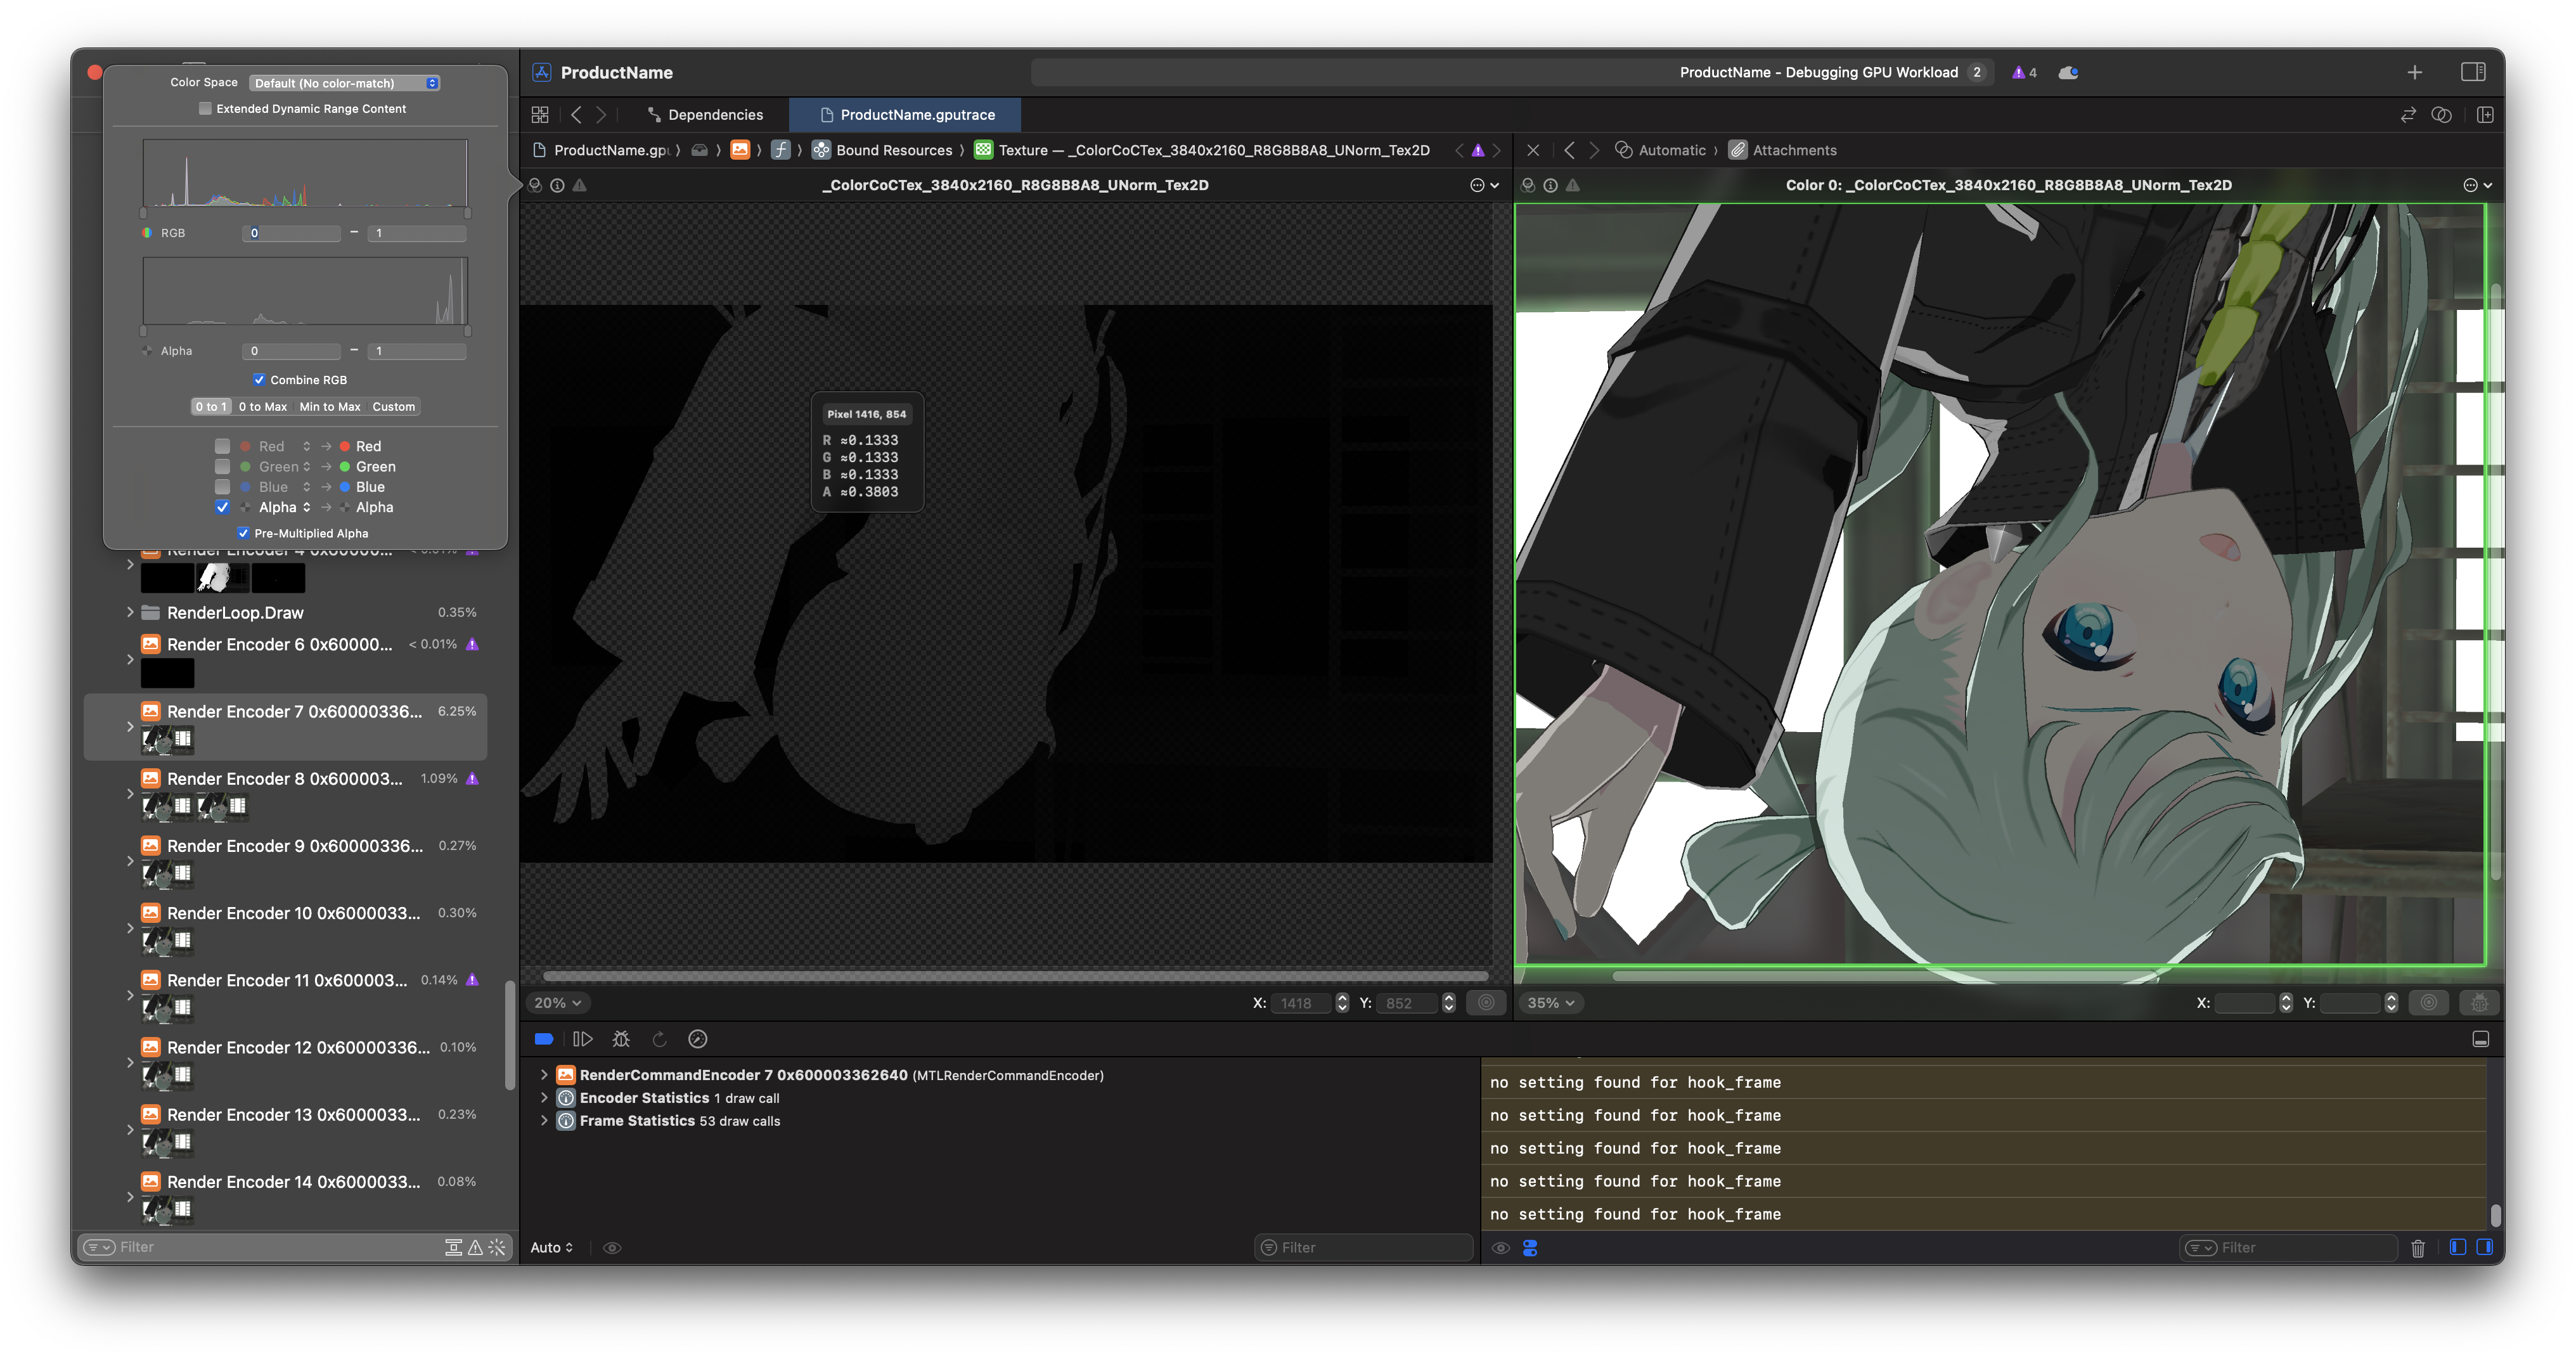
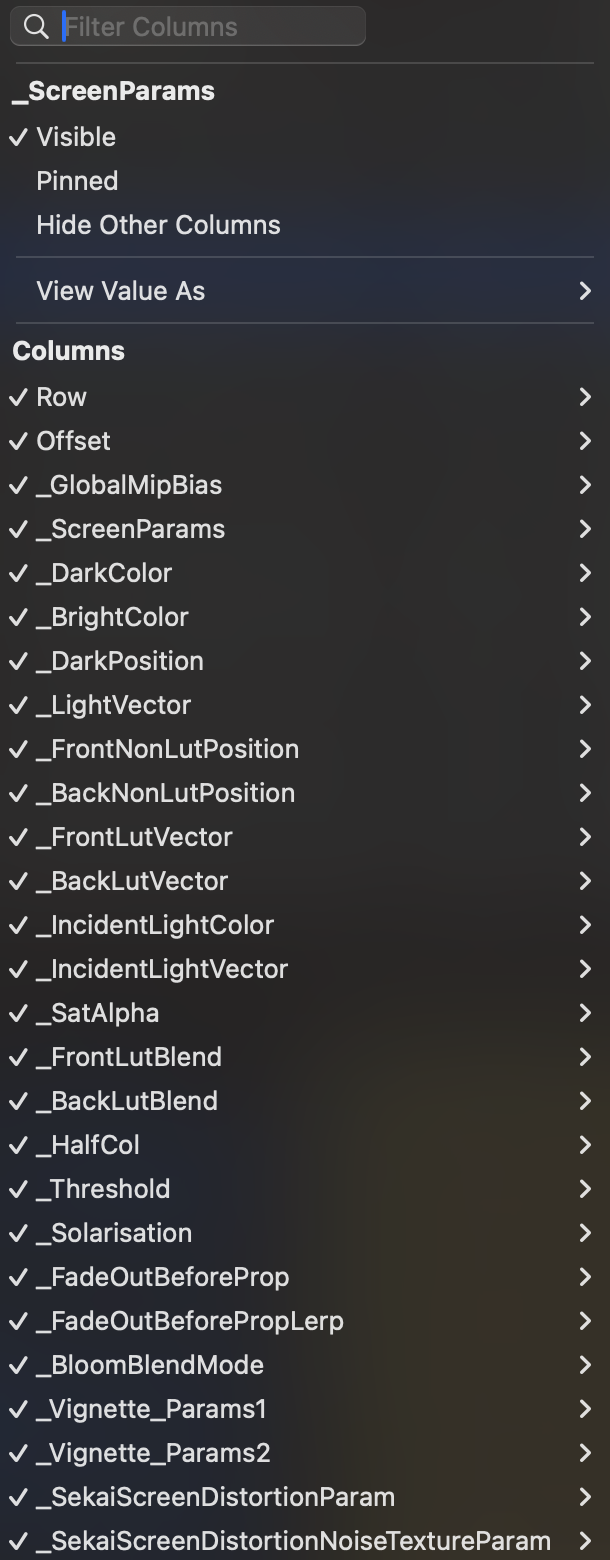
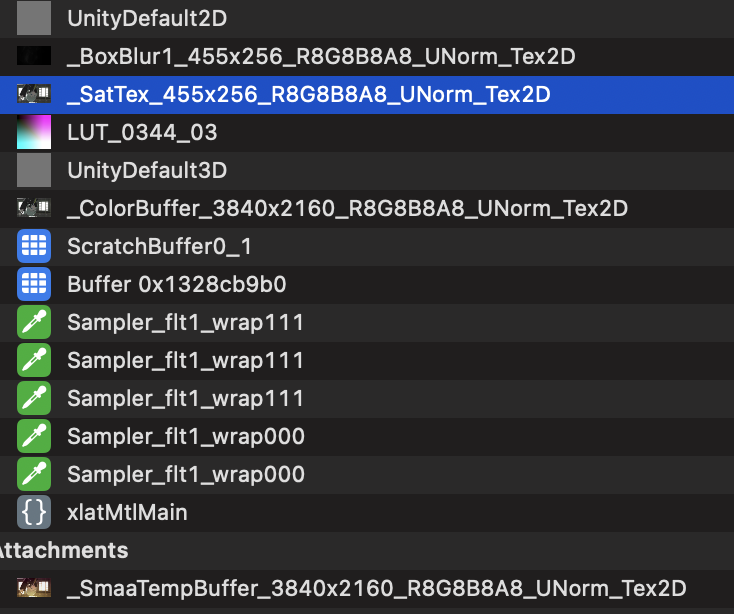
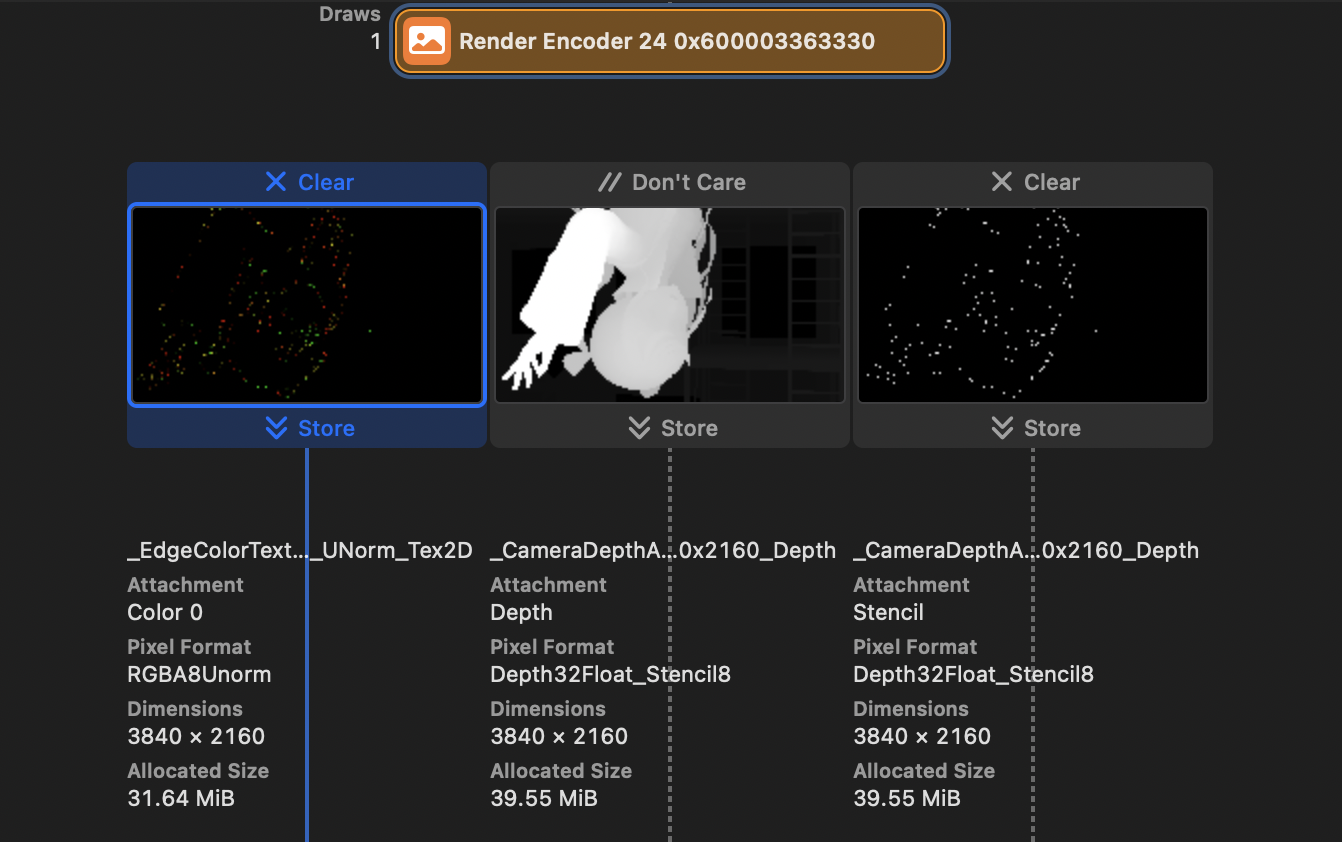
Above, you can see that the pipeline spits out 5 tex after processing the geometry; one image, two pairs of Depth-Stencils, and accidentally leaves a “Depth” and…. Brightness?
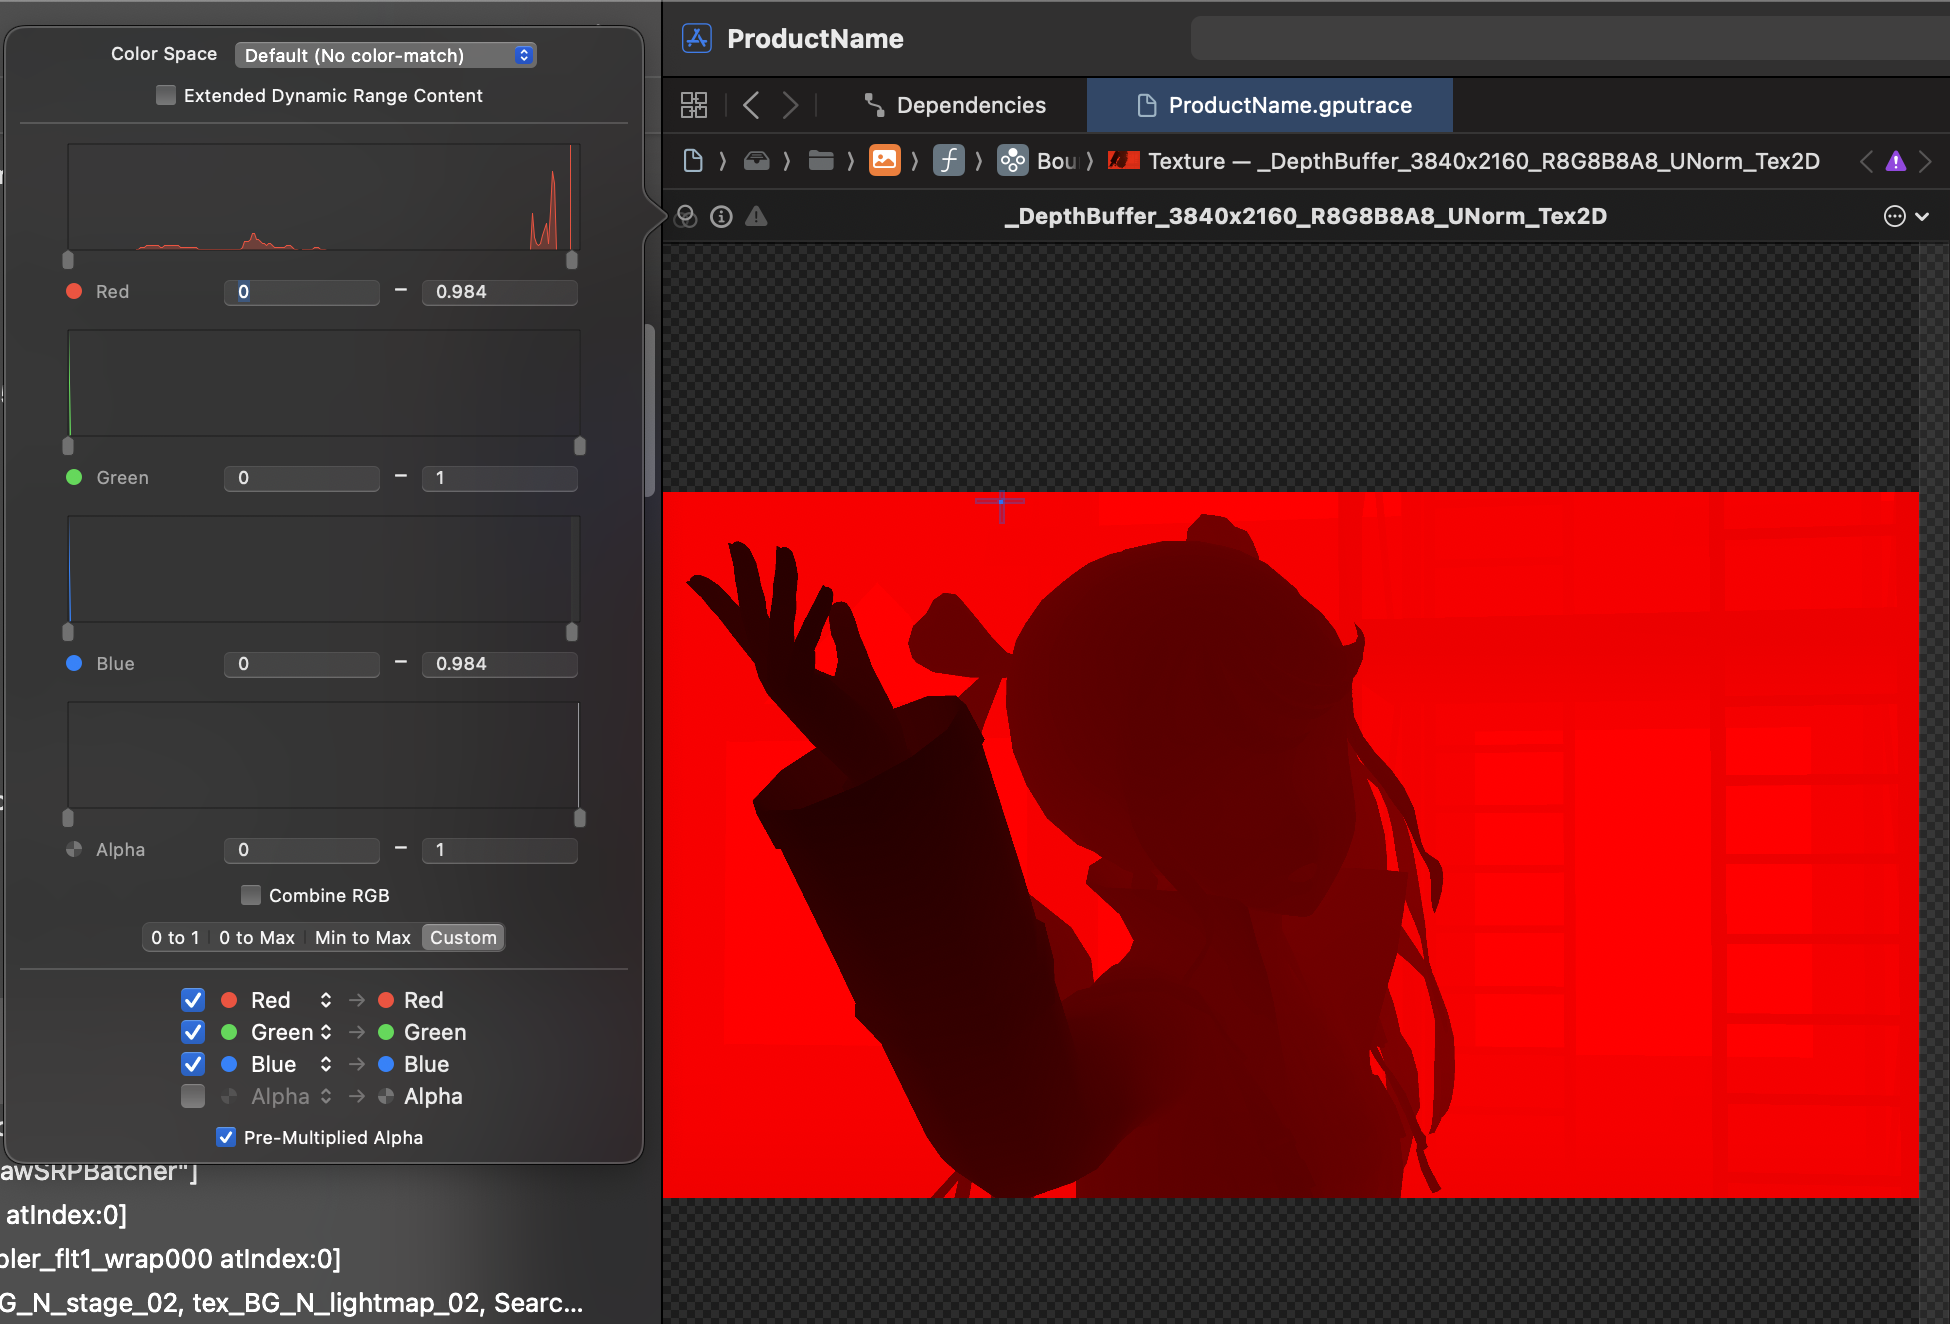
Here Depth is a depth buffer that uses only the $R$ channel; however, unlike the z-test buffer, the range of values in this buffer does not correspond to the NDC depth.
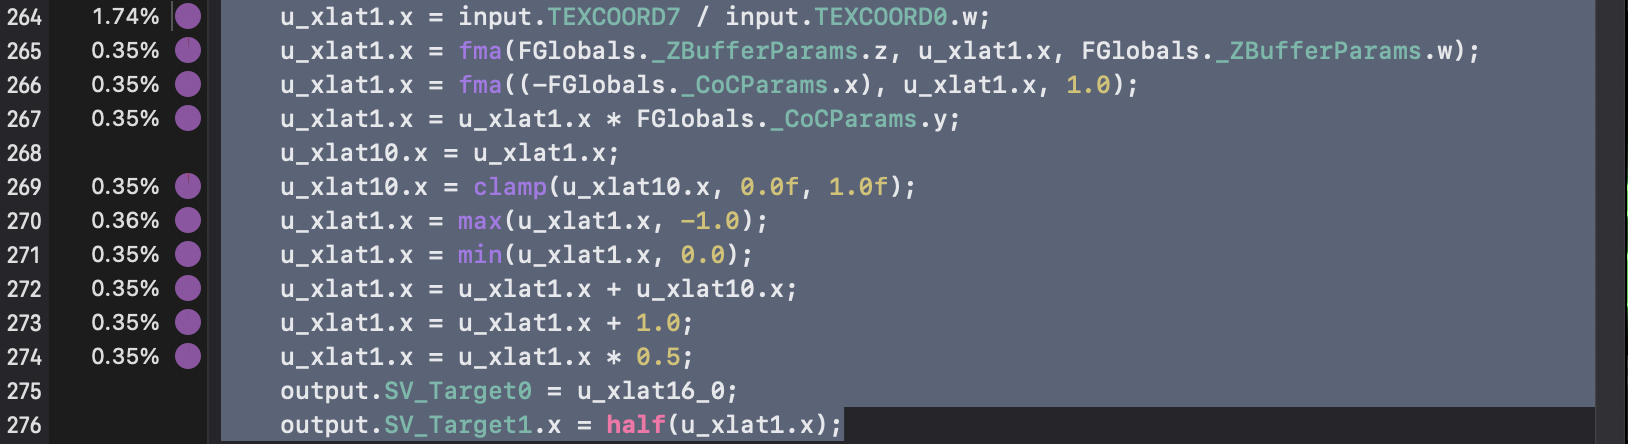
See the decompiler to see that this is a buffer for depth-of-field effects (note _CoCParams, CoC is Circle Of Confusion
The linear depth is applied to a simplified version (very similar to the above link) of the formula and put into the $[0,1]$ interval for storage
The material is integrated into the Alpha channel of _ColorCocTex at a later stage
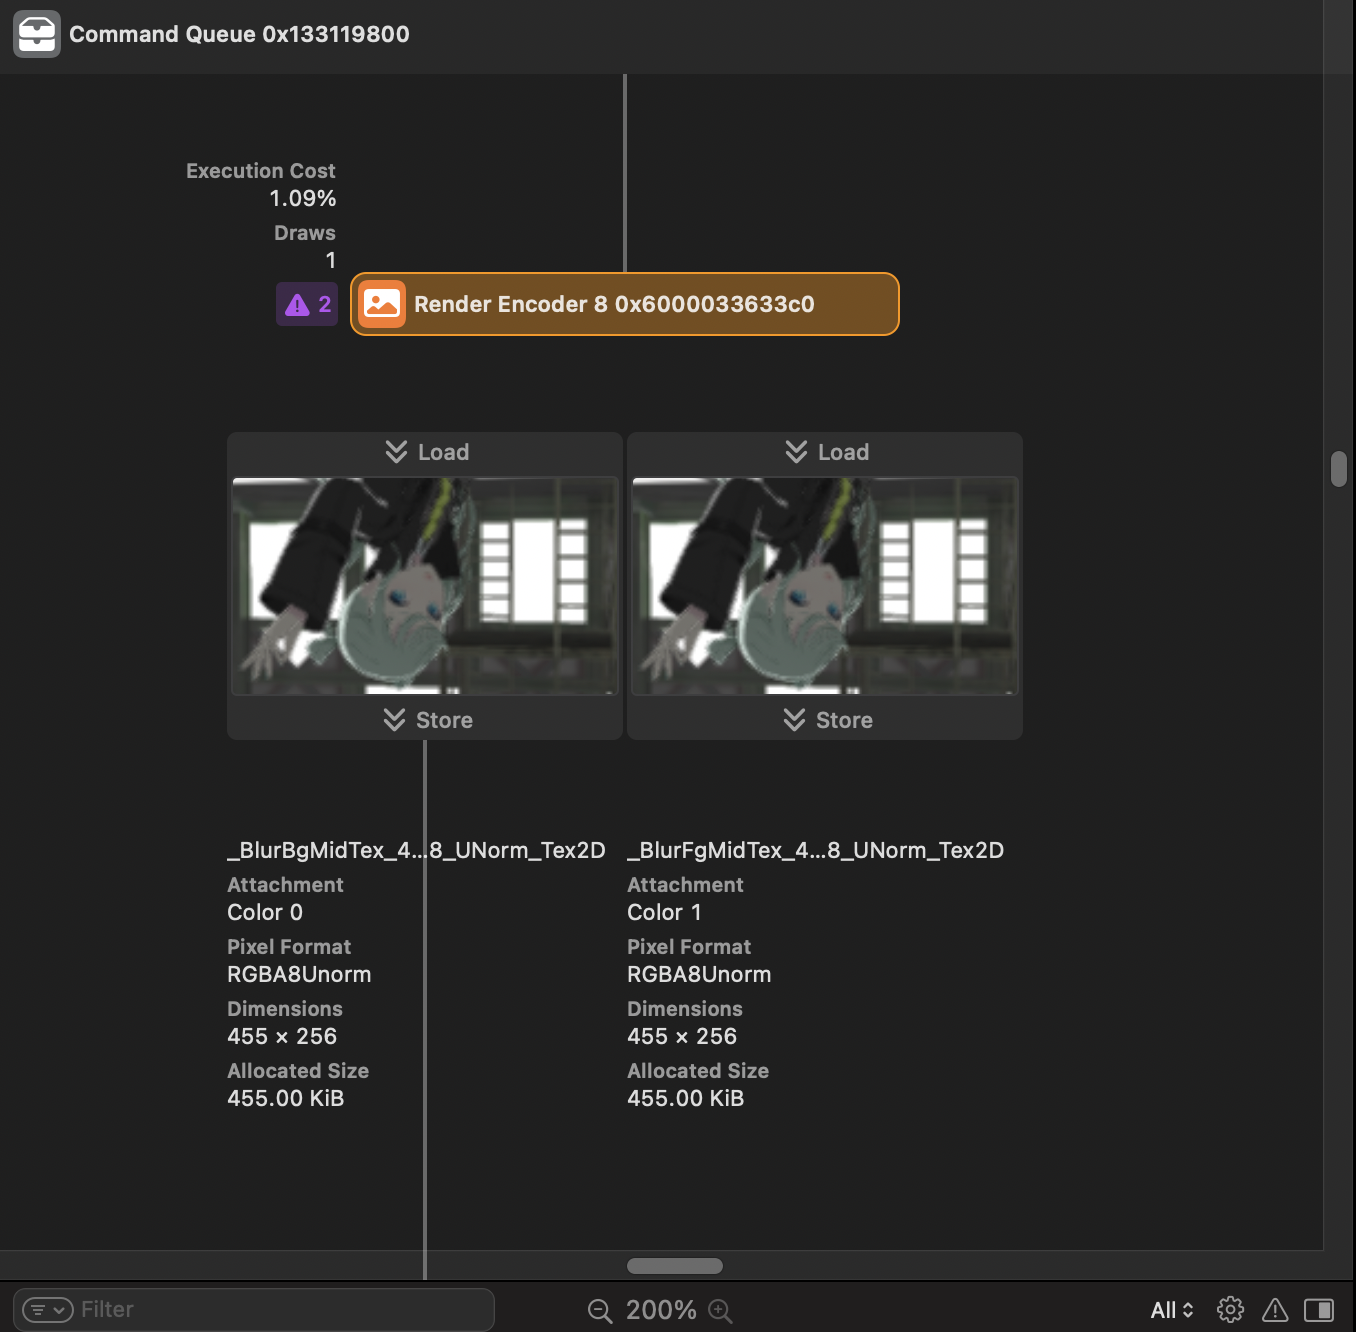
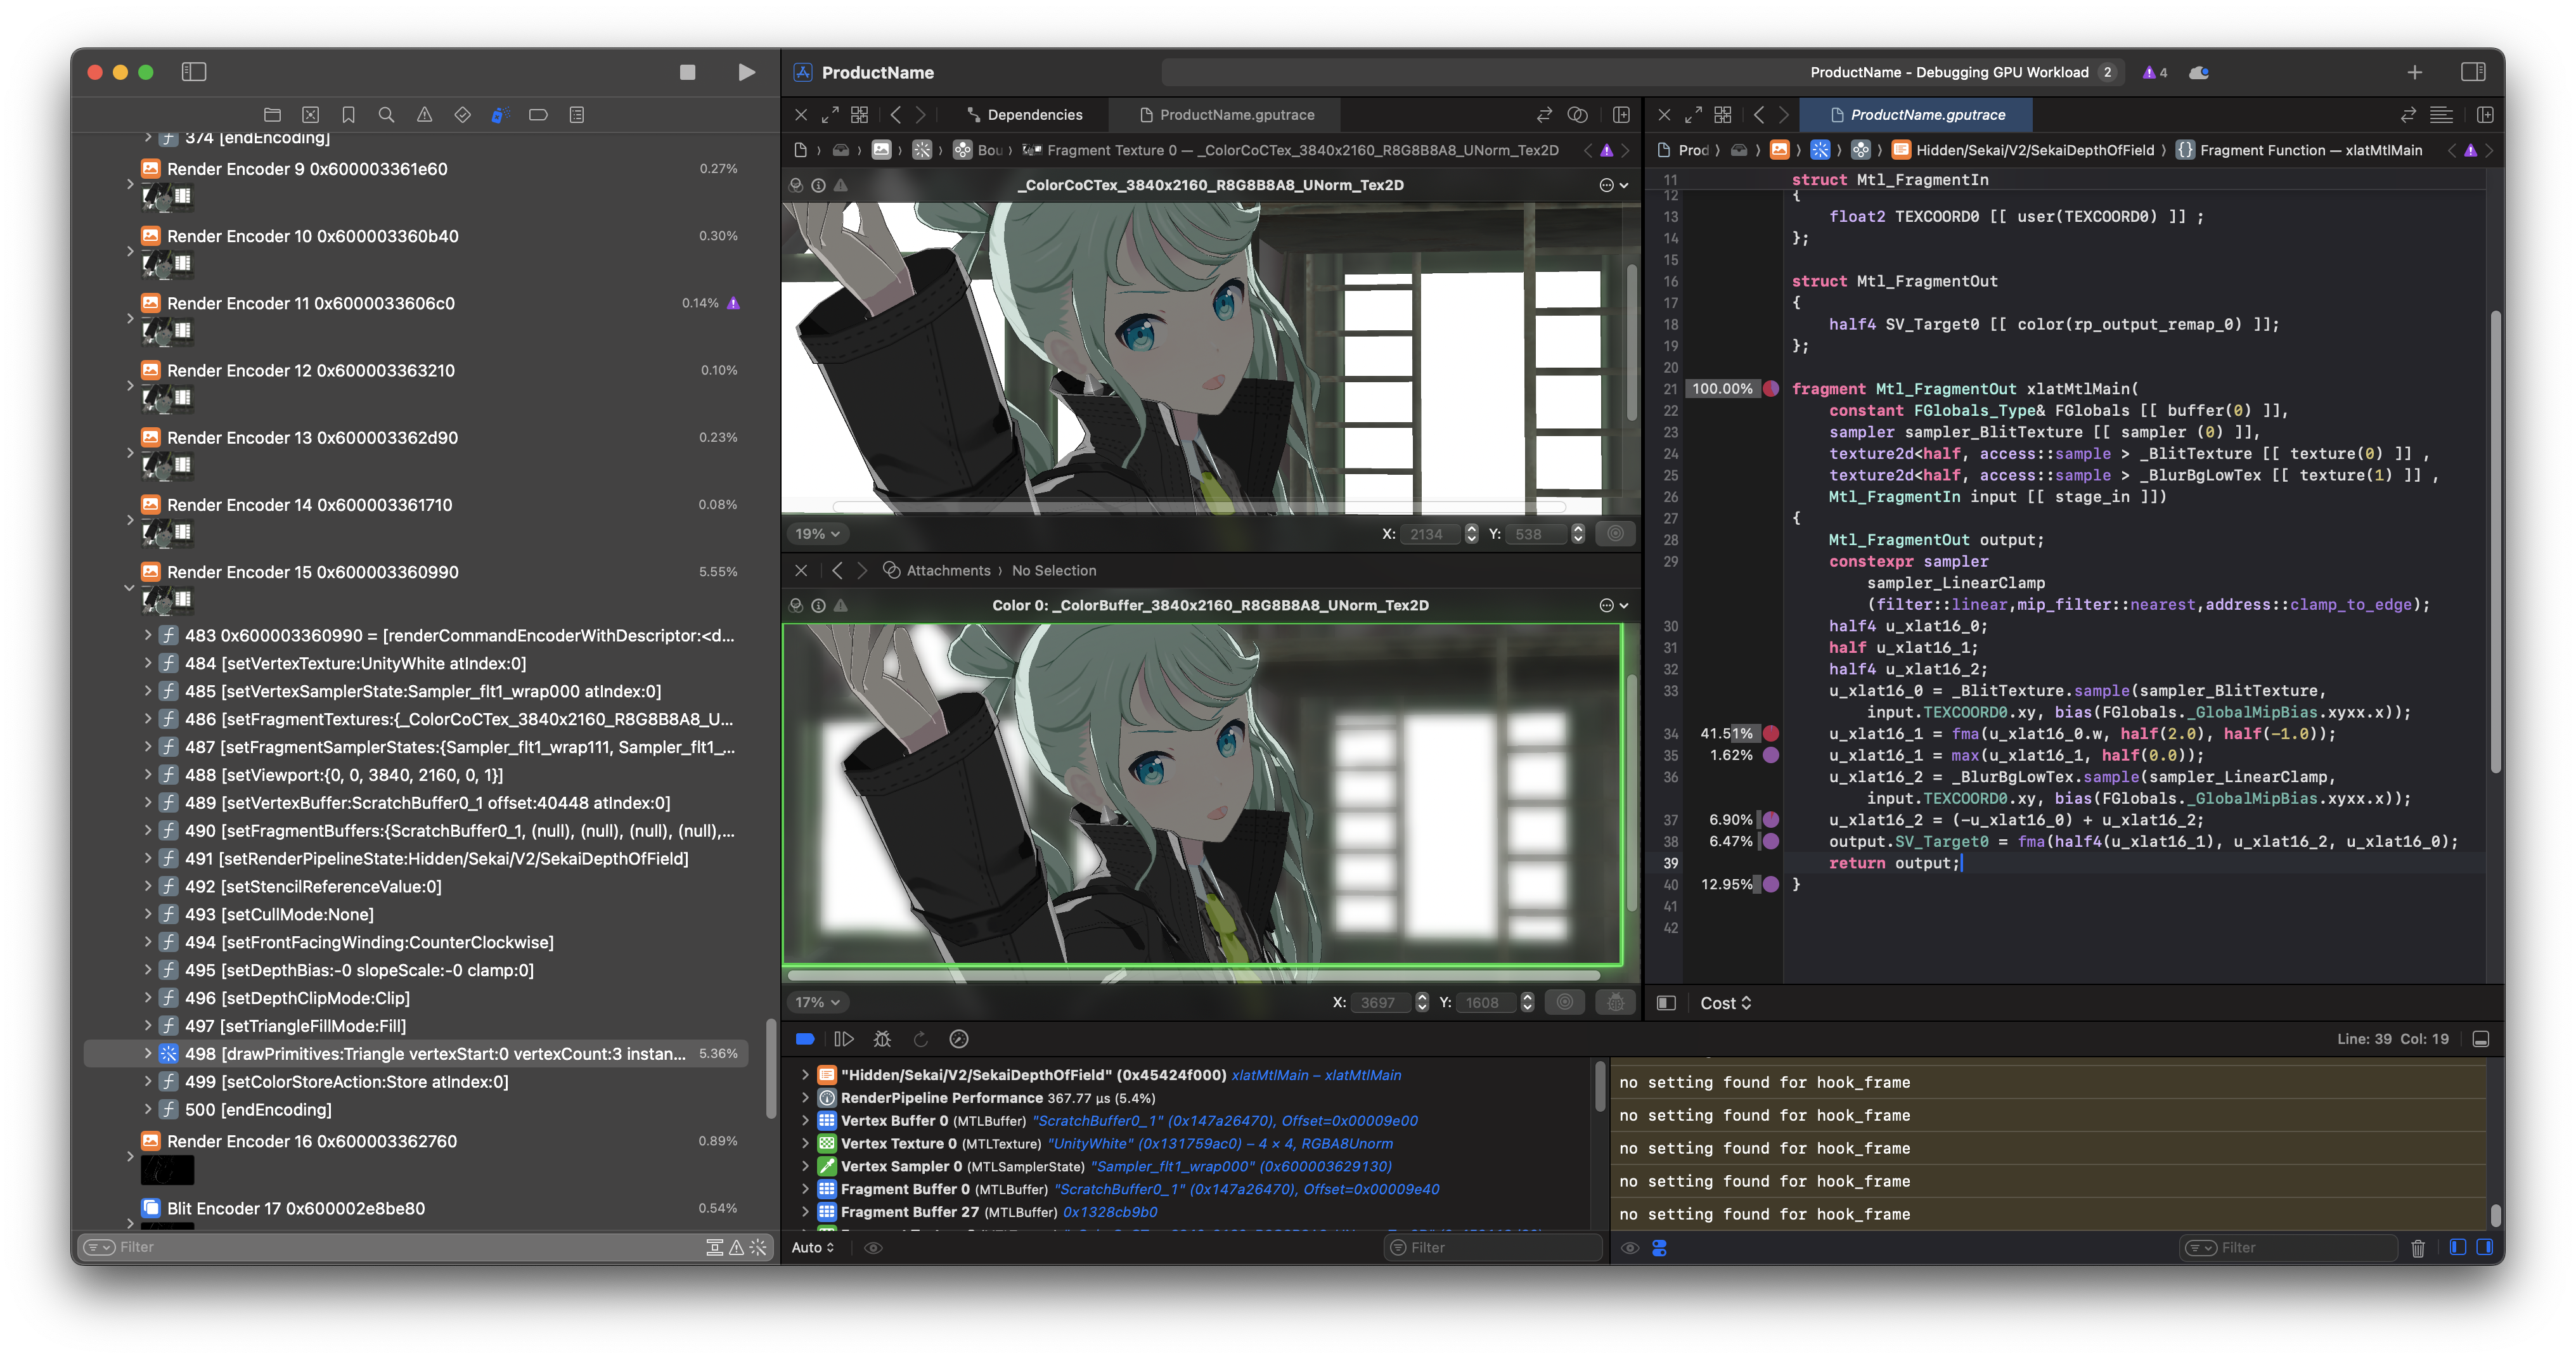
Afterwards, after simple Mip downsampling, a blurred version of the image is quickly generated and superimposed on the previous CoC value to form a post-depth-of-field image.
(Curious why there’s a useless Fg here… Will it be optimized away?)
Sampler is full of Linear/Nearest Mip Filter, figure omitted
…It’s pretty simple and brutal.
Bloom
Since the game isn’t doing HDR rendering, Brightness tex comes in handy here!
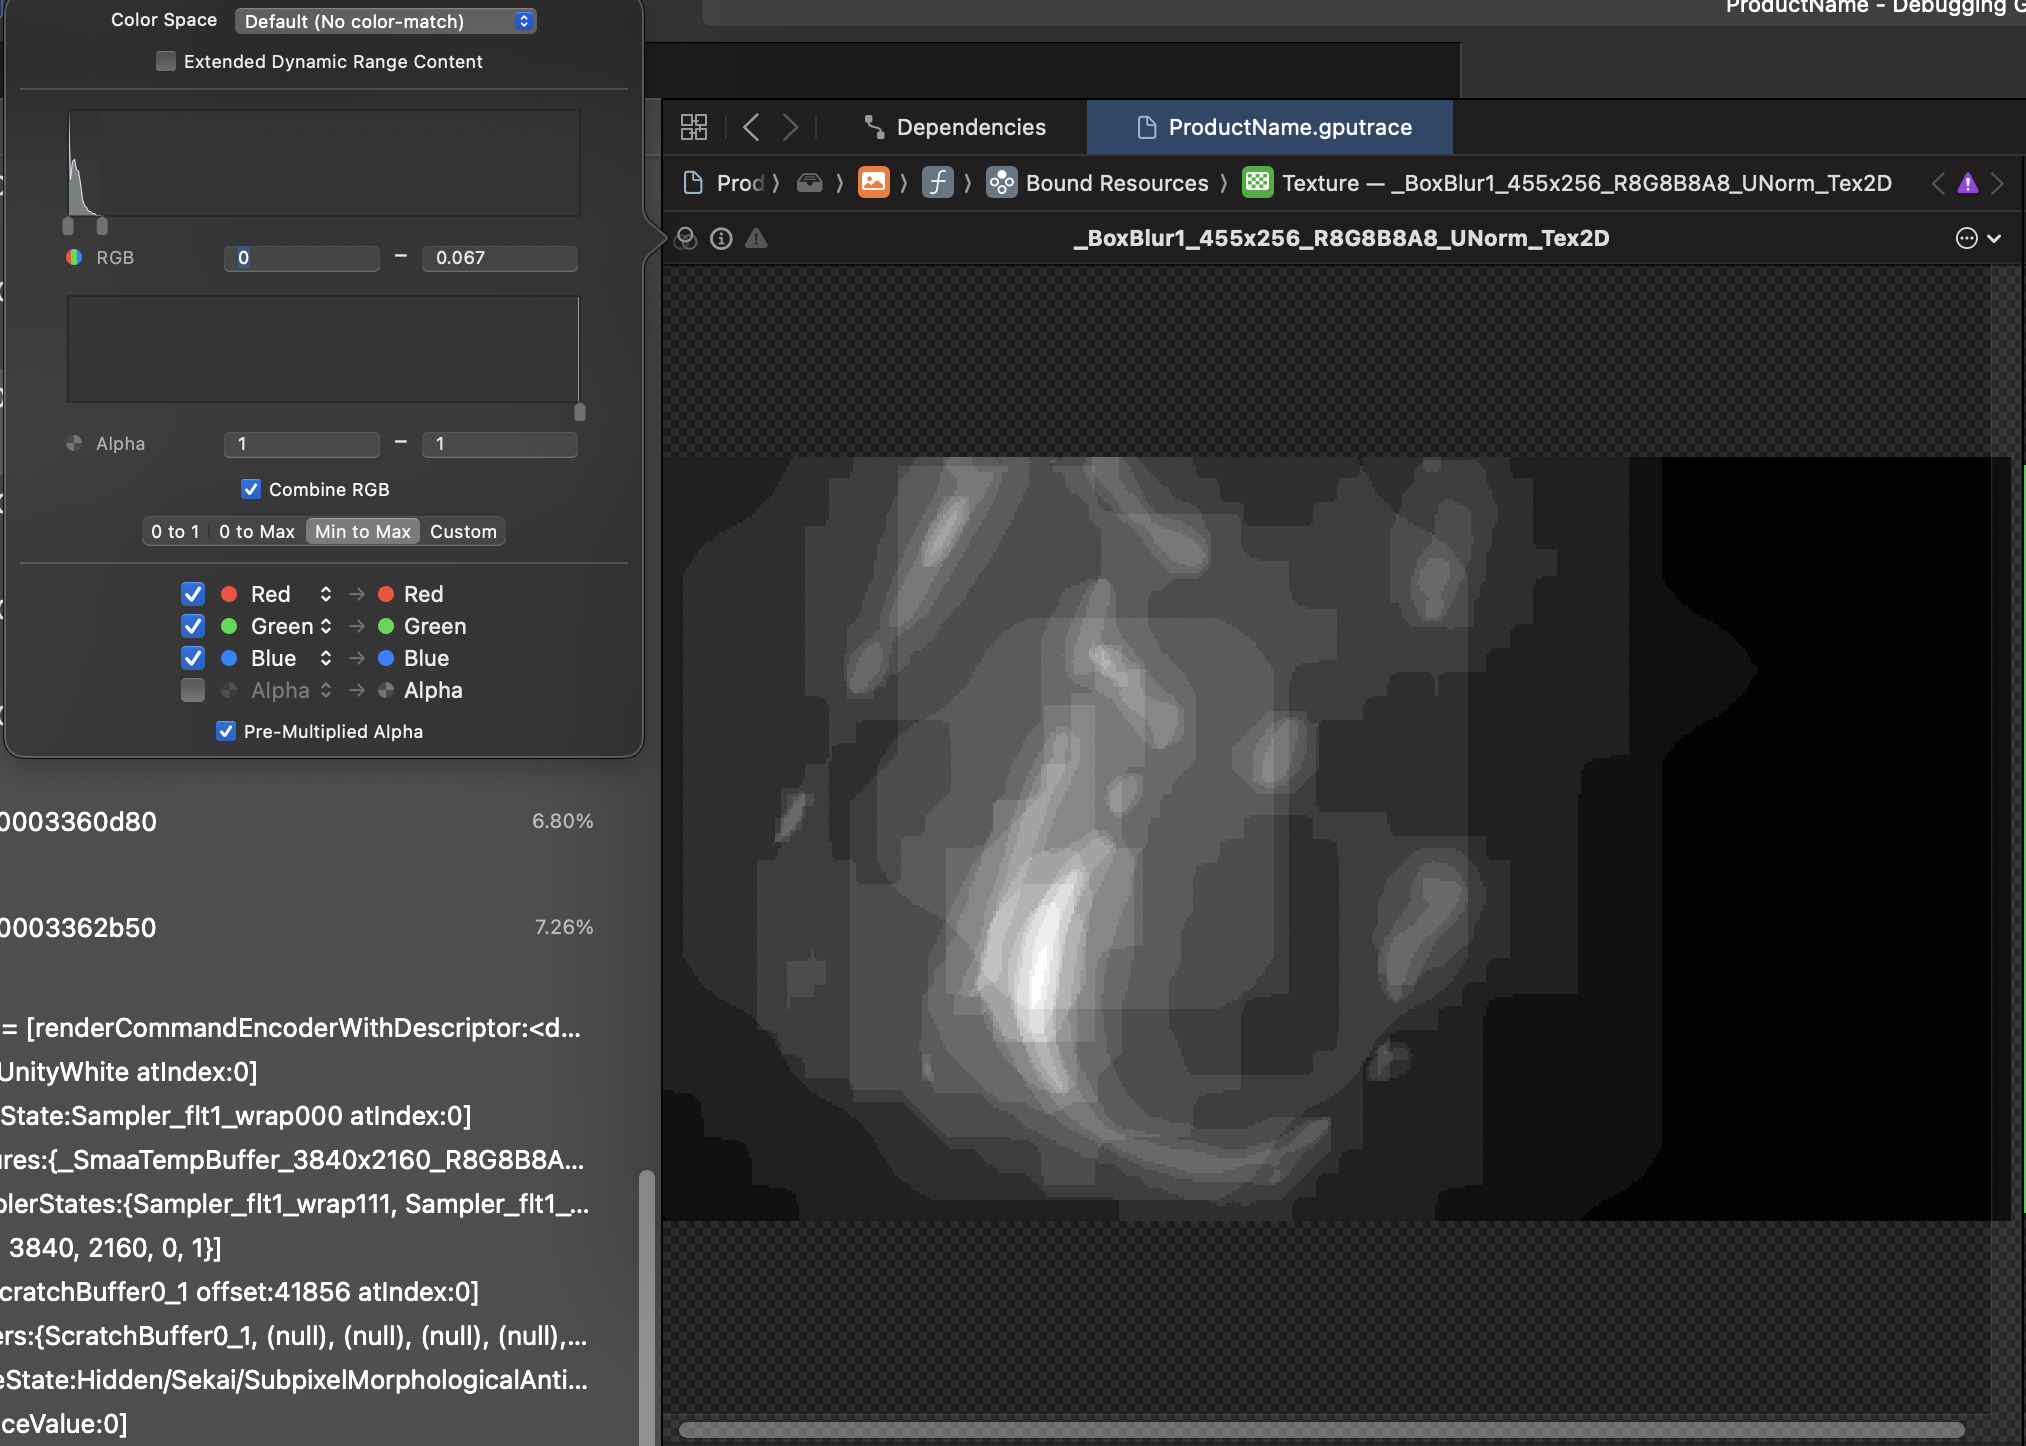
Doing Box Blur after post-processing and final compositing
Saturation?
In addition, the post-processing part of the LUT color gradation processing and some other parameters to control the effect of the
And a _SatTex after the same previous CoC downsampling, don’t know what for, but…
Debugging Metal shaders in Xcode is fairly easy:

Instant editorial response at the touch of a button; see SatTex in action!
Adjust the _SatAlpha value here, first at $0.5$:
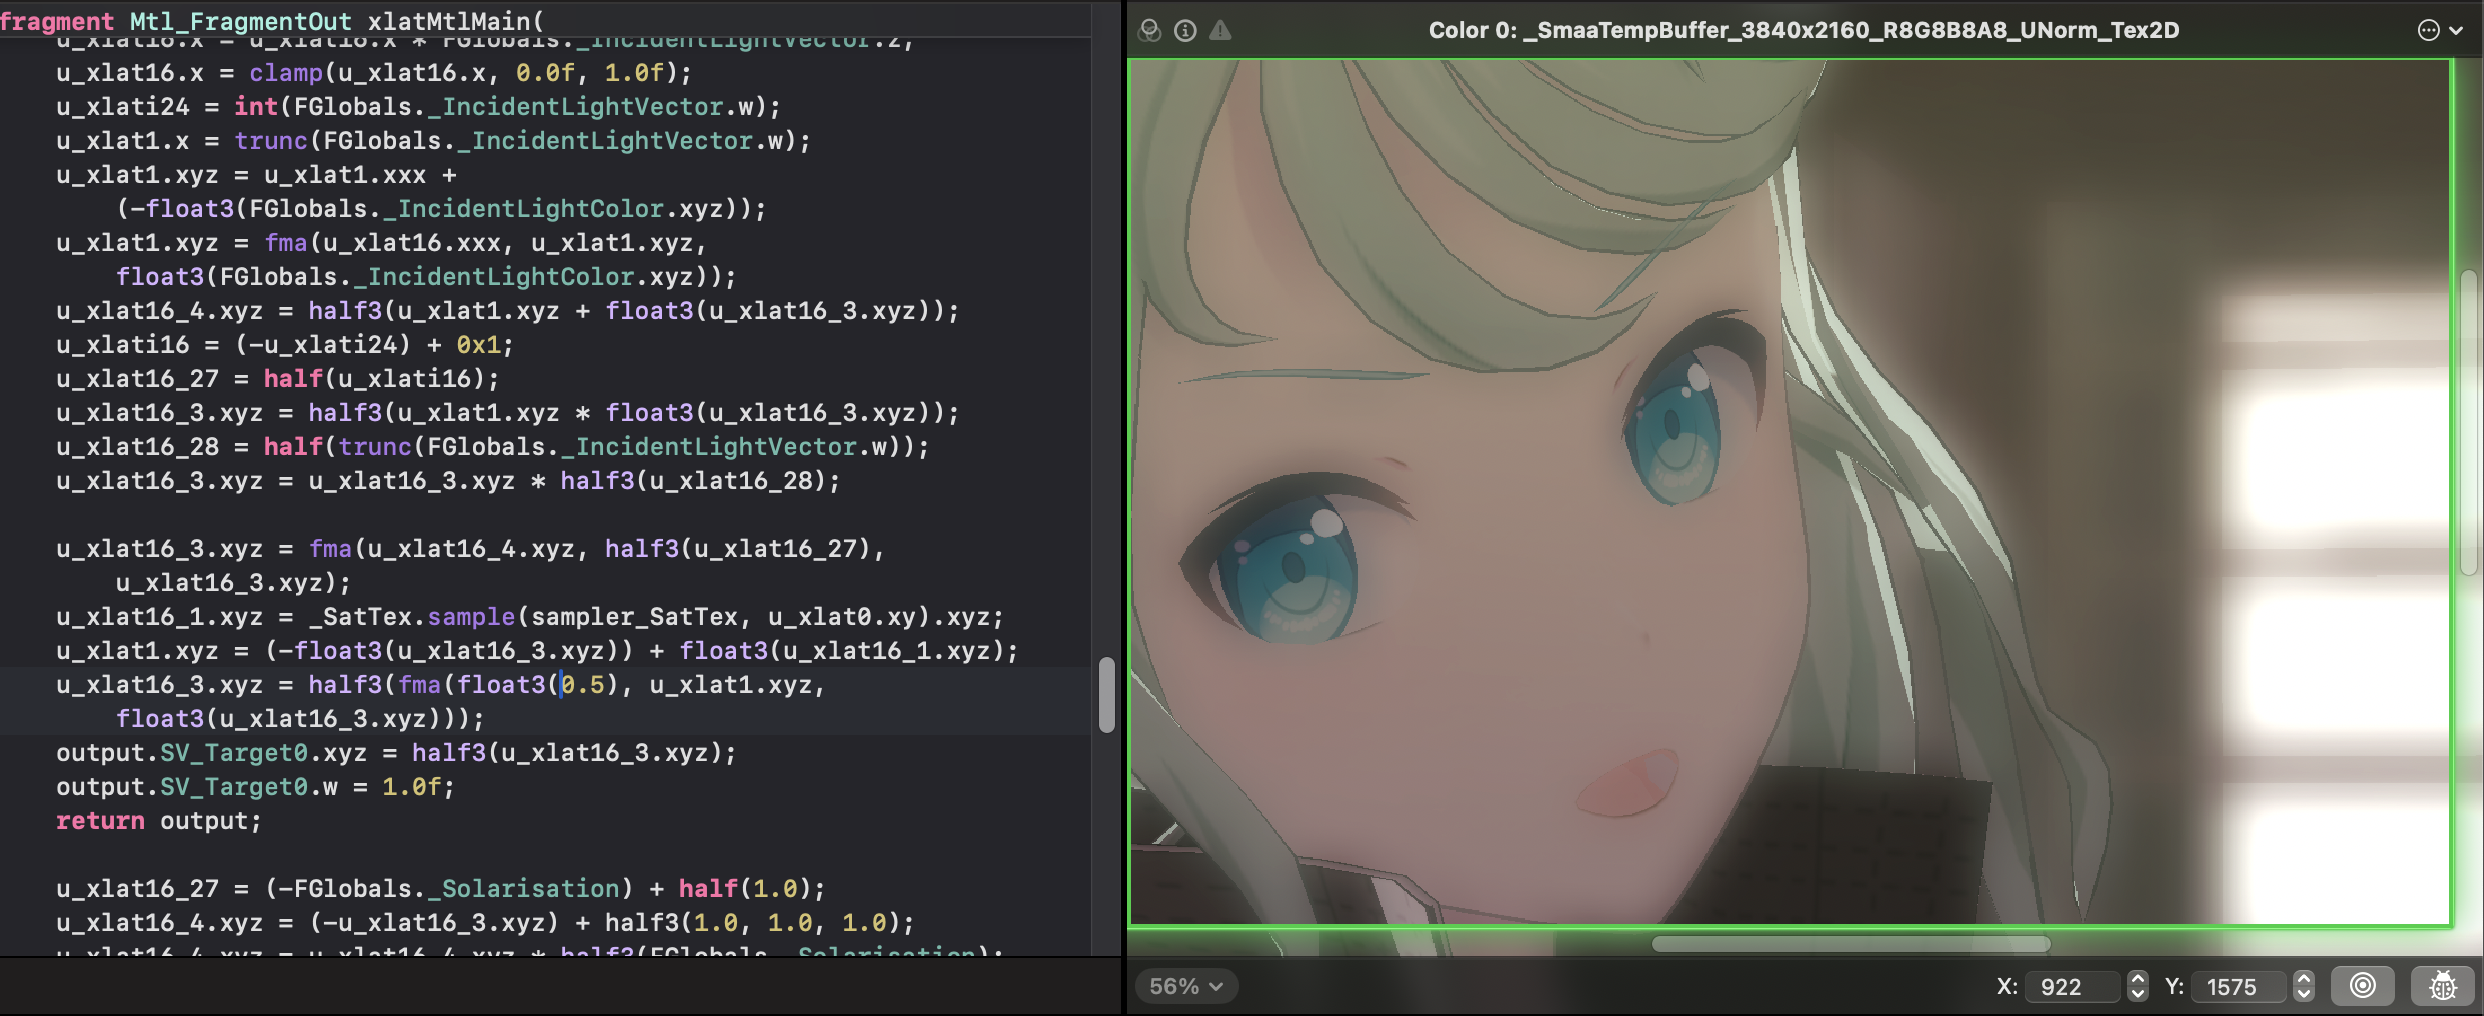
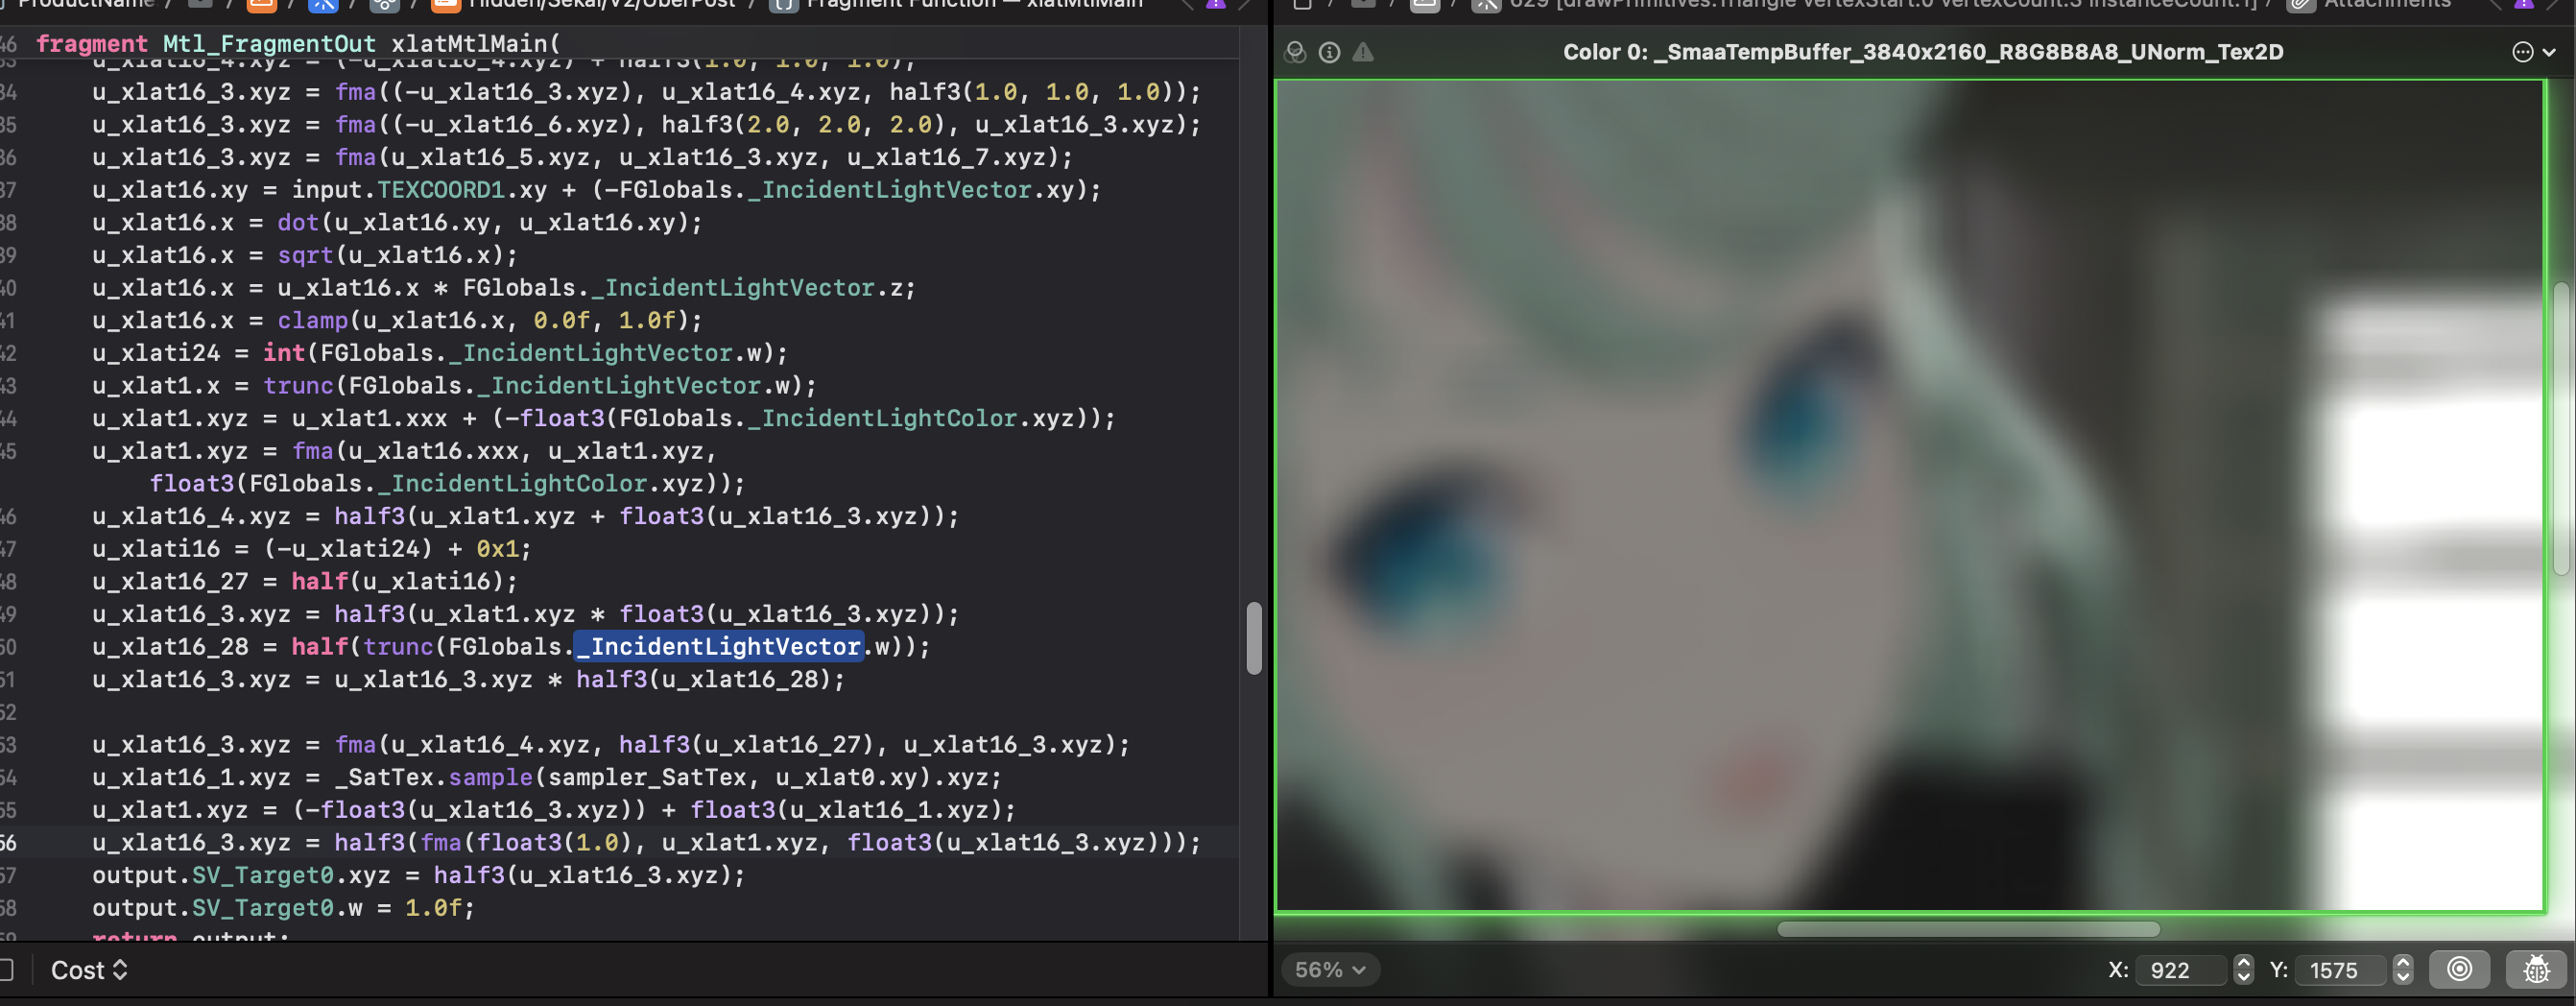
At $1.0$
At $0.0$
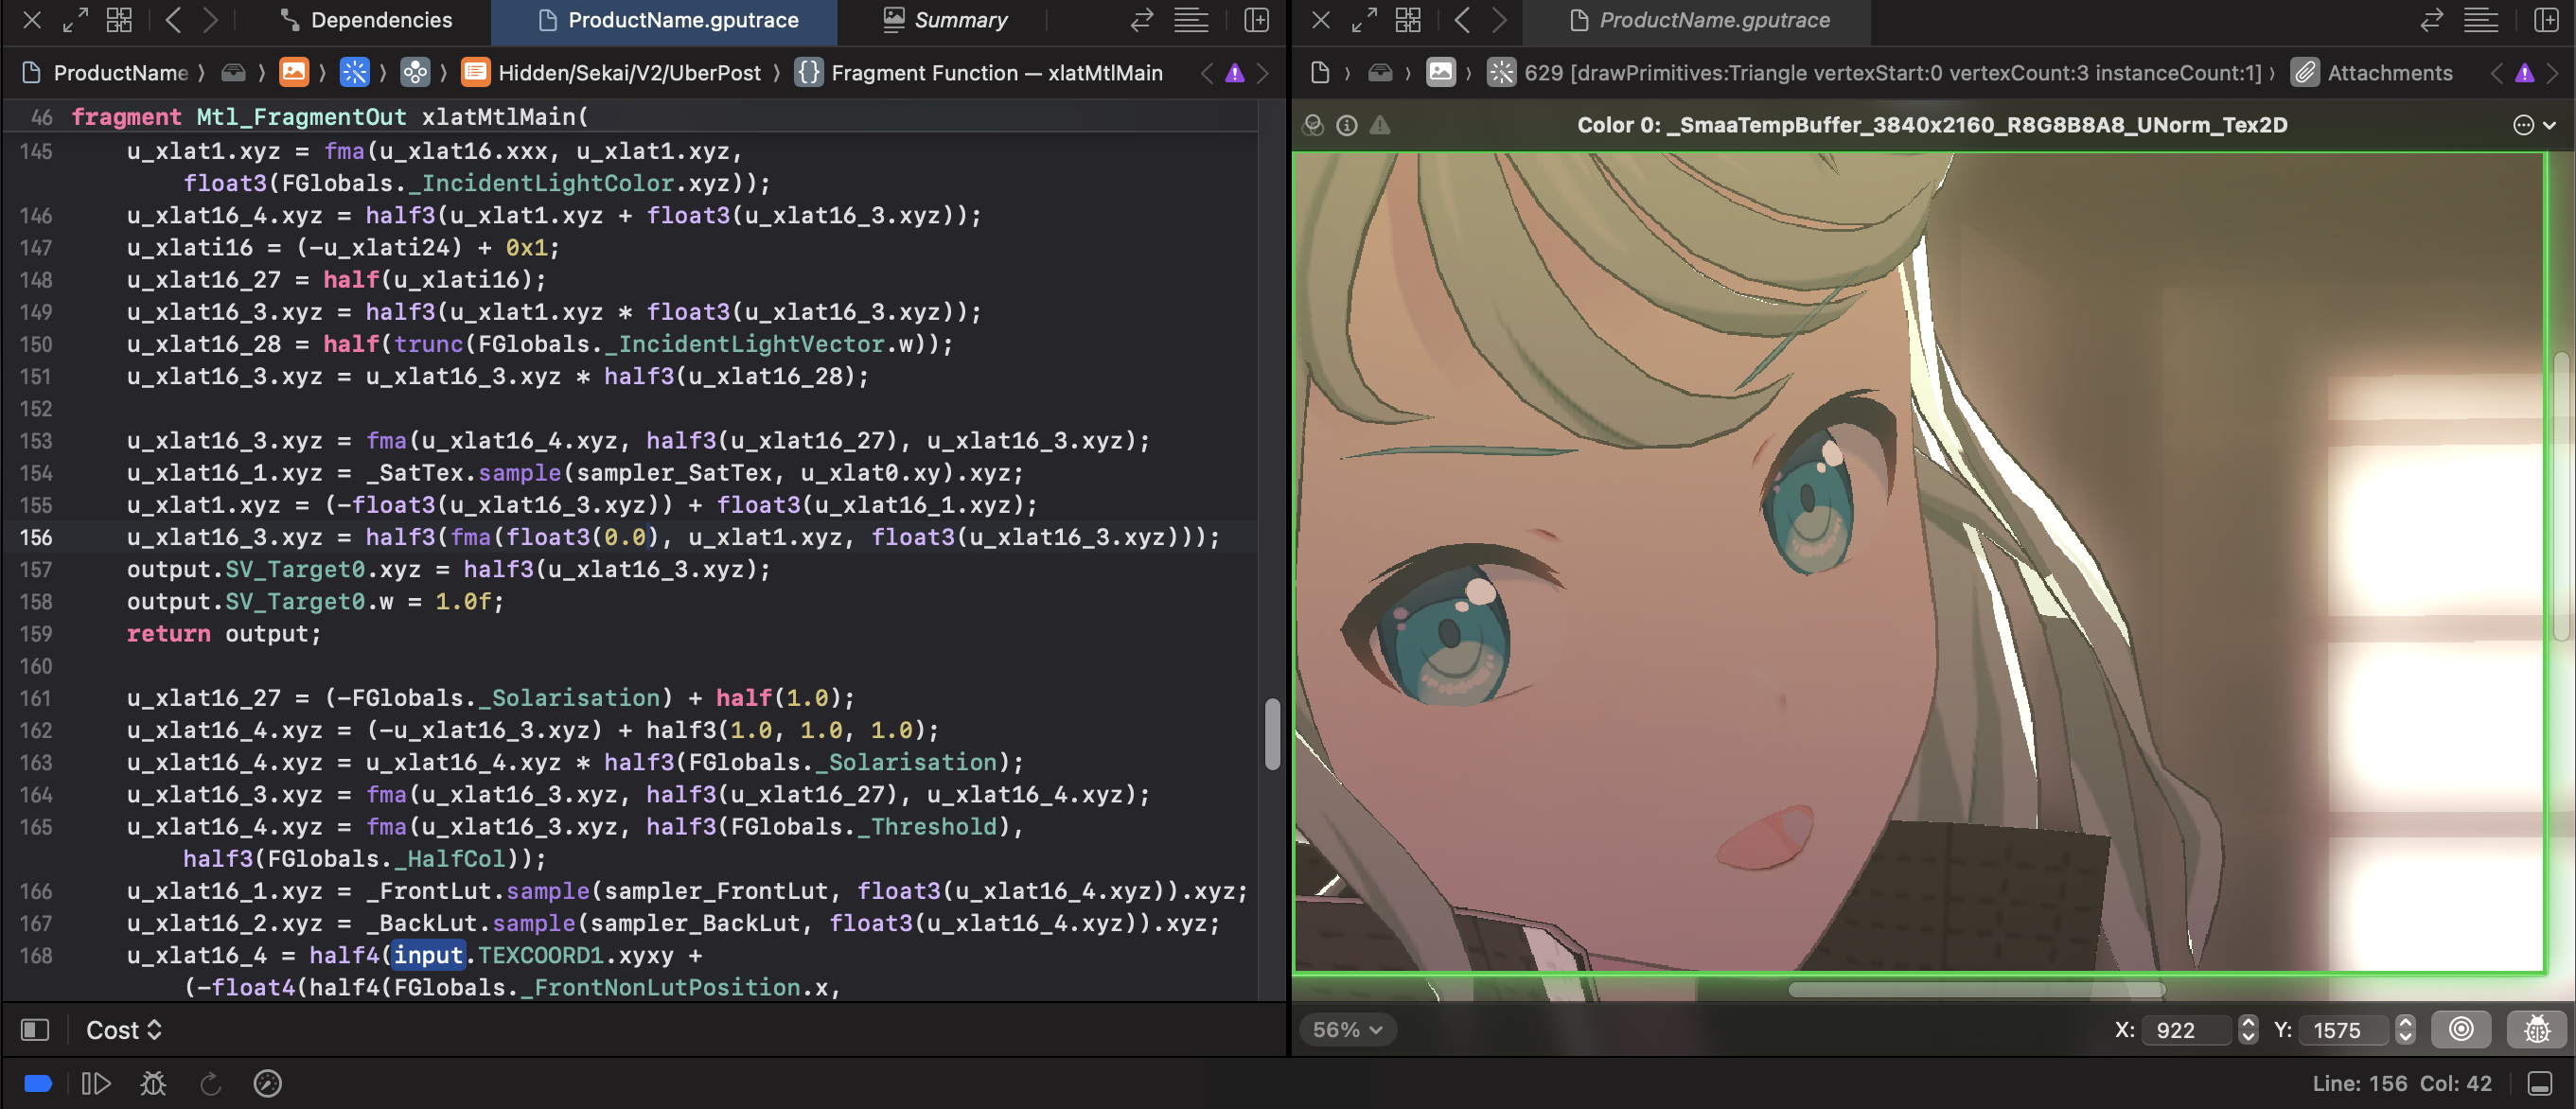
Refer to the code is also easy to know that the image with this value in the blur after the formal framebuffer to see the Lerp; the smaller the value of the effect of the more ‘clear’
The naming is a bit strange… Also the formal buffer has post-processing that the original blur didn’t have, and the transition isn’t natural
I can’t guess what I’m trying to accomplish yet orz.
SMAA
After the post-processing, do a SMAA and you’re basically done.
And finally to the aforementioned Flip - rendering over
Conclusion
First time writing a frame-by-frame analysis, and I have to say the workload is bigger than I thought it would be orz
In the future, I hope to fulfill a few of the flags sssekai_blender_io set by the end of the series, there’s a long way to go…
In addition to the following citation, here’s a special thanks to UnityPy and its groups and a couple of friends from Q Groups/Discord who are not at liberty to be named for their help + corrections + resources +…
SEE YOU SPACE COWBOY…
References
Real Time Rendering 4th Edition
https://mamoniem.com/behind-the-pretty-frames-detroit-become-human/
https://www.reedbeta.com/blog/circle-of-confusion-from-the-depth-buffer/
https://developer.apple.com/documentation/accelerate/fma
https://developer.apple.com/documentation/xcode/inspecting-shaders
https://www.saschawillems.de/blog/2019/03/29/flipping-the-vulkan-viewport/